


Showing posts with label ocean heat content. Show all posts
Showing posts with label ocean heat content. Show all posts
Thursday, September 5, 2013
Wednesday, September 4, 2013
Evidence continues to mount that the slowed warming of global surface temperatures is mainly due to changes in the oceans
by Dana Nuccitelli, Climate Consensus - The 97%, The Guardian, September 3, 2013
by Dana Nuccitelli, Climate Consensus - The 97%, The Guardian, September 3, 2013
A new study published in the journal Nature incorporates temperature changes in the tropical Pacific Ocean into an advanced climate model, and finds that the model can reproduce observed global surface temperature changes remarkably well.

This graph shows the good match between temperatures in the Nature paper model (in red) and measured temperatures (in black). Just accounting for human and solar climate influences doesn't reproduce the recent surface warming slowdown (in purple).
Importantly, as authors Yu Kosaka and Shang-Ping Xie from the Scripps Institution of Oceanography explain, accounting for the changes in the Pacific Ocean allows the model to reproduce the slowed global surface warming over the past 15 years. It also accurately reproduces the regional and seasonal changes in surface temperatures, which adds confidence that their results are meaningful.
These results are broadly consistent with several other important recent papers investigating the role of the oceans in global warming. For example, the model used in this study finds that the overall heating of the planet has not slowed when the warming of the oceans are taken into account, as studies led by John Abraham, myself, and several others have also concluded.
Research led by Gerald Meehl has similarly focused on the importance of the Pacific Ocean in short-term global surface temperature changes. His climate model predicts that there will be decades when surface temperature changes are relatively flat because more heat is transferred to the deep oceans, precisely as we have observed over the past decade. Meehl discussed the Kosaka & Xie study with Carbon Brief,
Thus the scientific picture is becoming increasingly clear that the Pacific Ocean has played a large role in the slowed surface warming in recent years, but the warming of the oceans and planet as a whole have continued unabated. Thus the slowed surface warming is very likely to be a temporary effect, similar to the flat global surface temperatures between 1940 and 1970 when the Pacific Ocean was in another cool cycle.
Although it may be a natural reaction to hope that the recent slowed surface warming suggests that climate change isn't an imminent threat, the scientific evidence simply does not support such optimism. Climate scientist Judith Curry, who I recently criticized for failing to grasp the concept of climate risk management, recently articulated this rosy view on her blog. By focusing at the model simulation data specifically from 1975 to 1998, Curry incorrectly argued that the study supports the position that global warming is mostly natural.
There are a few major problems with this argument. Between 1975 and 1998 when the Pacific Ocean was in a warm phase of its cycle, it accounted for some of the observed global surface warming (though less than Curry asserts; about 30%). But the thing about cycles – they're cyclical. Focusing on the warm cycles while ignoring the cool cycles is an example of classic cherry picking.
If we look at the full record, for both 1950–2012 and 1970–2012 (the Pacific Ocean temperature data are most reliable since 1970), according to the model used in this study, the Pacific Ocean has actually had a slight overall cooling effect on global surface temperatures. It's also important to note that this cycle is just moving heat around between oceans and air – the overall warming of the planet has remained steady and rapid.
Thus the body of scientific research consistently shows that global warming continues unabated, and is predominantly human-caused. The Pacific Ocean has likely played a significant role in the slowed global surface warming over the past 15 years by transferring more heat to the deep oceans, but that change appears to be a temporary one. When the Pacific Ocean enters its next warm cycle, we're likely to see a rapid warming of global surface temperatures. If we continue to use the temporary slowed surface warming as an excuse to delay climate action, we'll regret that decision when the surface warming kicks in with a vengeance.
http://www.theguardian.com/environment/climate-consensus-97-per-cent/2013/sep/03/global-warming-pacific-ocean-puzzle-piece
Our results show that the current hiatus is part of natural climate variability, tied specifically to La-Niña-like decadal cooling … For the recent decade, the decrease in tropical Pacific sea surface temperature has lowered the global temperature by about 0.15 degrees Celsius compared to the 1990s.Despite only covering 8.2% of the Earth's surface, these results suggest that the tropical Pacific Ocean plays a major role in short-term changes in the average global surface temperature. And over the past 15 years, it's offset most of the global surface warming from the increased greenhouse effect.
These results are broadly consistent with several other important recent papers investigating the role of the oceans in global warming. For example, the model used in this study finds that the overall heating of the planet has not slowed when the warming of the oceans are taken into account, as studies led by John Abraham, myself, and several others have also concluded.
Research led by Gerald Meehl has similarly focused on the importance of the Pacific Ocean in short-term global surface temperature changes. His climate model predicts that there will be decades when surface temperature changes are relatively flat because more heat is transferred to the deep oceans, precisely as we have observed over the past decade. Meehl discussed the Kosaka & Xie study with Carbon Brief,
This paper basically confirms, with a novel methodology, what we originally documented in our Nature Climate Change paper in 2011 and followed up with in our Journal of Climate paper ... We went beyond [the new paper] to show that when the tropical Pacific was cool for a decade ... more heat is mixed into the deeper ocean, something the new paper doesn't address.Kevin Trenberth, who co-authored several of these important ocean studies, has likewise pointed to the important role of the Pacific Ocean in transferring more heat to the deep oceans.
The cause of the shift is a particular change in winds, especially in the Pacific Ocean where the subtropical trade winds have become noticeably stronger, changing ocean currents and providing a mechanism for heat to be carried down into the ocean. This is associated with weather patterns in the Pacific, which are in turn related to the La Niña phase of the El Niño phenomenon.Research by Masahiro Watanabe of the Japanese Atmosphere and Ocean Research Institute has also suggested that the transfer of heat to the deep oceans and corresponding slowed global surface warming is related to changes in the Pacific.
Thus the scientific picture is becoming increasingly clear that the Pacific Ocean has played a large role in the slowed surface warming in recent years, but the warming of the oceans and planet as a whole have continued unabated. Thus the slowed surface warming is very likely to be a temporary effect, similar to the flat global surface temperatures between 1940 and 1970 when the Pacific Ocean was in another cool cycle.
Although it may be a natural reaction to hope that the recent slowed surface warming suggests that climate change isn't an imminent threat, the scientific evidence simply does not support such optimism. Climate scientist Judith Curry, who I recently criticized for failing to grasp the concept of climate risk management, recently articulated this rosy view on her blog. By focusing at the model simulation data specifically from 1975 to 1998, Curry incorrectly argued that the study supports the position that global warming is mostly natural.
There are a few major problems with this argument. Between 1975 and 1998 when the Pacific Ocean was in a warm phase of its cycle, it accounted for some of the observed global surface warming (though less than Curry asserts; about 30%). But the thing about cycles – they're cyclical. Focusing on the warm cycles while ignoring the cool cycles is an example of classic cherry picking.
If we look at the full record, for both 1950–2012 and 1970–2012 (the Pacific Ocean temperature data are most reliable since 1970), according to the model used in this study, the Pacific Ocean has actually had a slight overall cooling effect on global surface temperatures. It's also important to note that this cycle is just moving heat around between oceans and air – the overall warming of the planet has remained steady and rapid.
Thus the body of scientific research consistently shows that global warming continues unabated, and is predominantly human-caused. The Pacific Ocean has likely played a significant role in the slowed global surface warming over the past 15 years by transferring more heat to the deep oceans, but that change appears to be a temporary one. When the Pacific Ocean enters its next warm cycle, we're likely to see a rapid warming of global surface temperatures. If we continue to use the temporary slowed surface warming as an excuse to delay climate action, we'll regret that decision when the surface warming kicks in with a vengeance.
http://www.theguardian.com/environment/climate-consensus-97-per-cent/2013/sep/03/global-warming-pacific-ocean-puzzle-piece
Monday, August 19, 2013
Review of Geophysics, 2013; DOI: 10.1002/rog.20022
A review of global ocean temperature observations: Implications for ocean heat content estimates and climate change
Abstract
http://onlinelibrary.wiley.com/doi/10.1002/rog.20022/abstract
A review of global ocean temperature observations: Implications for ocean heat content estimates and climate change
Abstract
The evolution of ocean temperature measurement systems is presented with a focus on the development and accuracy of two critical devices in use today (expendable bathythermographs and CTDs – conductivity-temperature-depth instruments used on Argo floats). A detailed discussion of the accuracy of these devices and a projection of the future of ocean temperature measurements are provided. The accuracy of ocean temperature measurements is discussed in detail in the context of ocean heat content, Earth's energy imbalance, and thermosteric sea level rise. Up-to-date estimates are provided for these three important quantities. The total energy imbalance at the top-of-atmosphere is best assessed by taking an inventory of changes in energy storage. The main storage is in the ocean; the latest values of which are presented. Furthermore, despite differences in measurement methods and analysis techniques, multiple studies show that there has been a multi-decadal increase in the heat content of both the upper and deep ocean regions, which reflect the impact of anthropogenic warming. With respect to sea-level rise, mutually reinforcing information from tide gauges and radar altimetry show that presently, sea-level is rising at approximately 3 mm yr-1 with contributions from both thermal expansion and mass accumulation from ice melt. The latest data for thermal expansion sea-level rise are included here and analyzed.
http://onlinelibrary.wiley.com/doi/10.1002/rog.20022/abstract
Friday, July 12, 2013
Efforts to predict the near-term climate are taking off, but their record so far has been patchy.

JASIEK KRZYSZTOFIAK/NATURE
In August 2007, Doug Smith took the biggest gamble of his career. After more than ten years of work with fellow modellers at the Met Office's Hadley Centre in Exeter, UK, Smith published a detailed prediction of how the climate would change over the better part of a decade1. His team forecasted that global warming would stall briefly and then pick up speed, sending the planet into record-breaking territory within a few years.
The Hadley prediction has not fared particularly well. Six years on, global temperatures have yet to shoot up as it projected. Despite this underwhelming result, such near-term forecasts have caught on among many climate modellers, who are now trying to predict how global conditions will evolve over the next several years and beyond. Eventually, they hope to offer forecasts that will enable humanity to prepare for the decade ahead just as meteorologists help people to choose their clothes each morning.
In preparation for the IPCC report, the first part of which is due out in September, some 16 teams ran an intensive series of decadal forecasting experiments with climate models. Over the past two years, a number of papers based on these exercises have been published, and they generally predict less warming than standard models over the near term. For these researchers, decadal forecasting has come of age. But many prominent scientists question both the results and the utility of what is, by all accounts, an expensive and time-consuming exercise.These near-term forecasts stand in sharp contrast to the generic projections that climate modellers typically produce, which look many decades ahead and don't represent the actual climate at any given time. “This is very new to climate science,” says Francisco Doblas-Reyes, a modeller at the Catalan Institute of Climate Sciences in Barcelona, Spain, and a lead author of a chapter that covers climate prediction for a forthcoming report by the Intergovernmental Panel on Climate Change (IPCC). “We're developing an additional tool that can tell us a lot more about the near-term future.”
“Although I have nothing against this endeavour as a research opportunity, the papers so far have mostly served as a 'disproof of concept',” says Gavin Schmidt, a climate modeller at NASA's Goddard Institute for Space Studies in New York, which declined to participate in the IPCC's decadal-predictions experiment.
Initial ideas
To make its climate prediction, Smith's team used its standard climate model, but broke the mould by borrowing ideas from the way meteorologists forecast the weekly weather. Typical climate projections start some way back in the past, often well before the industrial era, in a bid to capture the average climate well enough to forecast broad patterns over the long term. Weekly weather forecasts, however, begin with the present. They make multiple simulations with slightly different initial meteorological conditions to give an array of outcomes that has some statistical validity despite the weather's inherent chaos.
Smith and his team applied this same approach. They collected a slew of climate measurements — air temperature, wind speed and direction, atmospheric pressure, ocean temperature and salinity — for 20 days during 2005. For each prediction, they 'initialized' the Hadley Centre's main climate model by plugging in a single day's data. Then they ran the model forward for a decade under the influence of various factors such as rising greenhouse-gas concentrations.

SOURCE: DOUG SMITH/REFS 1 & 6
By starting in the present with actual conditions, Smith's group hoped to improve the model's accuracy at forecasting the near-term climate. The results looked promising at first. The model initially predicted temperatures that were cooler than those seen in conventional climate projections — a forecast that basically held true into 2008. But then the prediction's accuracy faded sharply: the dramatic warming expected after 2008 has yet to arrive (see 'Hazy view'). “It's fair to say that the real world warmed even less than our forecast suggested,” Smith says. “We don't really understand at the moment why that is.”
The answer may lie in the oceans. Although the atmosphere largely controls day-to-day weather, the slow-moving oceans hold so much more energy and heat that they dominate how the climate changes from year to year. Researchers suspect that much of this variability is tied to widespread cycles, such as the El Niño warming and La Niña cooling system in the eastern tropical Pacific. In theory, the fact that salt water circulates more slowly than air should also make the oceans a little easier to model.
In 2008, a group of climate modellers led by Noel Keenlyside, now at the University of Bergen in Norway, made a prediction through to 2030 that incorporated the effects of sea surface temperatures in the Atlantic2. They focused on one of the Atlantic's dominant current patterns, the meridional overturning circulation. This carries sun-baked waters from the tropics to the north Atlantic, where it releases heat into the atmosphere, before sinking into the deep ocean and travelling south again. The model predicted that this circulation would weaken, helping to stabilize or even cool global temperatures over the next several years.
The prediction sparked a furore: some researchers questioned the Keenlyside team's analysis as well as the way the model was initialized. The highly publicized study also became wrapped up in a broader debate in the media about whether global warming had paused. Shortly after the study came out, a group of scientists led by Stefan Rahmstorf, an oceanographer at the Potsdam Institute for Climate Impact Research in Germany, publicly refuted the paper and challenged Keenlyside's group to a pair of bets together worth €5,000 (US$6,525) if the predictions bore fruit.
“We felt a need to make it publicly known that this was not climate science as such that was predicting a cooling period,” Rahmstorf says. Keenlyside and his team did not take the bets, which turned out to be a smart choice. The circulation did not flag and the temperatures were higher than predicted, says Rahmstorf.
Keenlyside acknowledges the model's shortcomings, but says that it captured at least the initial trends in global temperatures, which did not rise in the first few years of the prediction period. “Our system was very crude, but we were able to show that initializing the oceans is very important in these models,” he says.
Despite their faults, such efforts helped spark a wave of research among modellers who are hungry for ways to test and improve their calculations. The global climate-modelling groups that took part in the IPCC's experiments invested a substantial portion of their modelling time to produce the first systematic predictions of how the global climate will evolve in the coming years. These models predict cooler temperatures: on average 15% less warming over the next few decades compared with standard climate projections3.
To determine whether these projections are likely to hold, the groups ran the usual test of seeing how well their models performed when hindcasting, or predicting the past. The teams plugged in all of the observational data and ran decadal climate predictions at least every five years beginning in 1960, comparing the resulting hindcasts to the actual climate as well as standard climate models. In one such analysis4, Doblas-Reyes and his colleagues say that their model anticipated the slowdown in global warming up to five years in advance. Their paper also bolstered the theory that the deep oceans, notably the Atlantic and tropical Pacific, had stalled atmospheric warming by absorbing much of the heat being trapped by rising concentrations of greenhouse-gas concentrations in the air (see ‘Lost heat’).
Error correction
These results have yet to win over sceptics such as Rahmstorf, who questions whether the models are accurately anticipating variations in Earth's climate, but many others say that the newer simulations are showing some skill at a regional level, particularly within the oceans.
“We do see that there are some improvements,” says Lisa Goddard, a climate scientist at Columbia University in New York who is heading a systematic analysis and comparison of the predictions from the IPCC models5. Many models, for instance, captured a sudden warming of sea surface temperatures in the North Atlantic that began around 1995. “They all predict the shift beautifully,” Goddard says. “Unfortunately, from what I hear, different models are doing it for different reasons.”
If so, the models' success could be deceptive: whatever accuracy they show for the first year or two of their predictions might stem in part from the fact that the simulations start off with a snapshot of the current climate. Because the climate does not usually change drastically from one year to the next, the model is bound to start off predicting conditions that are close to reality. But that effect quickly wears off as the real climate evolves. If this is the source of the models' accuracy, that advantage fades quickly after a few years.
Although the prediction experiments show limited forecasting skill at the moment, modellers are trying to use these exercises to improve their creations. One key challenge is the way in which the models are initialized. To start a simulation, modellers plug as many values as possible into a three-dimensional grid of the oceans and atmosphere. But modellers must make assumptions for areas without data, including the deep oceans.
Another challenge stems from the fact that each model has its own equilibrium state — the climate that it generates naturally if left on its own. By plugging in actual values for the ocean and atmosphere, researchers pull the model away from its natural state. When the model starts to run forward in time, it immediately begins to drift back to its preferred climate, which can introduce additional complications.
“What are the causes of that drift?” asks Doblas-Reyes. By comparing prediction simulations with conventional climate projections, scientists hope to correct for that drift and detect problems in the models that would otherwise remain hidden. “If these models can help scientists identify systematic errors, it will benefit the entire climate-modelling community,” says Doblas-Reyes.
Schmidt says that these efforts are “a little misguided.” He argues that it is difficult to attribute success or failure to any particular parameter because the inherent unpredictability of weather and climate is built into both the Earth system and the models. “It doesn't suggest any solutions,” he says.
Even advocates have no illusions about the challenges ahead. Kevin Trenberth, a climate scientist at the National Center for Atmospheric Research in Boulder, Colorado, says that it could be a decade or more before this research really begins to pay off in terms of predictive power, and even then climate scientists will be limited in what they can say about the future. But many people might welcome hints about what's to come. “For a farmer in Illinois,” Trenberth says, “any indications about what to expect could turn out rather valuable.”
Smith says that his group at the Hadley Centre has doubled the resolution of its model, which now breaks the planet into a grid with cells 150 kilometres on each side. Within a few years, he hopes to move to a 60-kilometre grid, which will make it easier to capture the connections between ocean activities and the weather that society is interested in. With improved models, more data and better statistics, he foresees a day when their models will offer up a probabilistic assessment of temperatures and perhaps even precipitation for the coming decade.
In preparation for that day, he has set up a 'decadal exchange' to collect, analyse and publish annual forecasts. Nine groups used the latest climate models to produce ten-year forecasts beginning in 2011. An analysis of the ensemble6 shows much the same pattern as Smith's 2007 prediction: temperatures start out cool and then rise sharply, and within the next few years, barring something like a volcanic eruption, record temperatures seem all but inevitable.
“I wouldn't be keen to bet on that at the moment,” Smith says, “but I do think we're going to make some good progress within a few years.”
- Nature
- 499,
- 139–141
- ()
- doi:10.1038/499139a
Sunday, June 2, 2013
Peter Sinclair is knocking out so many great posts every day that I can't keep up! Here is his latest interview with climate scientist Kevin Trenberth.
I’ll be doing a longer video piece on the whole issue of climate sensitivity that has been current over the last few months. One of the first people I wanted to talk to was Dr. Kevin Trenberth – and you can see part of the longer Skype interview above. Trenberth contributed to a recent paper showing that the deeper ocean has been collecting more heat over recent years, a factor that has to be considered in any discussion of global surface temps in the past decade or two.
Below, you can read Dr. Trenberth’s very valuable discussion of the issue, recently posted on the “Conversation” blog series out of Australia.
Has global warming stalled? This question is increasingly being asked because the local weather seems cool and wet, or because the global mean temperature is not increasing at its earlier rate or the long-term rate expected from climate model projections.
The answer depends a lot on what one means by “global warming.” For some it is equated to the “global mean temperature.” That keeps going up but also has ups and downs from year to year. More on that shortly.
Why should it go up? Well, because the planet is warming as a result of human activities. With increasing carbon dioxide and other heat-trapping greenhouse gases in the atmosphere, there is an imbalance in energy flows in and out of the top of the atmosphere: the greenhouse gases increasingly trap more radiation and hence create warming. “Warming” really means heating, and this can exhibit itself in many ways.
Rising surface temperatures are just one manifestation. Melting Arctic sea ice is another. So is melting of glaciers and other land ice that contribute to rising sea levels. Increasing the water cycle and invigorating storms is yet another. But most (more than 90%) of the energy imbalance goes into the ocean, and several analyses have now shown this. But even there, how much warms the upper layers of the ocean, as opposed to how much penetrates deeper into the ocean where it may not have much immediate influence, is a key issue.

The ups and downs of global temperature
My colleagues and I have just published a new analysis showing that in the past decade about 30% of the heat has been dumped at levels below 700 m, where most previous analyses stop.
The first point is that this is fairly new; it is not there throughout the record. The cause of the shift is a particular change in winds, especially in the Pacific Ocean where the subtropical trade winds have become noticeably stronger, changing ocean currents and providing a mechanism for heat to be carried down into the ocean. This is associated with weather patterns in the Pacific, which are in turn related to the La Niña phase of the El Niño phenomenon.
Ocean Heat Content from 0 to 300 meters (grey), 700 m (blue), and total depth (violet) from ORAS4, as represented by its 5 ensemble members. The time series show monthly anomalies smoothed with a 12-month running mean, with respect to the 1958–1965 base period. Hatching extends over the range of the ensemble members and hence the spread gives a measure of the uncertainty as represented by ORAS4 (which does not cover all sources of uncertainty). The vertical colored bars indicate a two year interval following the volcanic eruptions with a 6 month lead (owing to the 12-month running mean), and the 1997–98 El Niño event again with 6 months on either side. On lower right, the linear slope for a set of global heating rates (W/m2) is given.
The second point is that we have found distinctive variations in global warming with El Niño. A mini global warming, in the sense of a global temperature increase, occurs in the latter stages of an El Niño event, as heat comes out of the ocean and warms the atmosphere. The ocean’s temperature is also affected by volcanic eruptions, which also affect the perceptions of global warming.
Normal weather also interferes by generating clouds that reflect the sunshine, and there are fluctuations in the global energy imbalance from month to month. But these average out over a year or so.
Another prominent source of natural variability in the Earth’s energy imbalance is changes in the sun itself, seen most clearly as the sunspot cycle. From 2005 to 2010 the sun went into a quiet phase and the warming energy imbalance is estimated to have dropped by about 10 to 15%.
Some of the penetration of heat into the depths of the ocean is reversible, as it comes back in the next El Niño. But a lot is not; instead it contributes to the overall warming of the deep ocean. This means less short-term warming at the surface, but at the expense of greater long-term warming, and faster sea level rise. So this has consequences.
Global warming is here to stay
Coming back to the global temperature record, one thing is clear. The past decade is by far the warmest on record. Human induced global warming really kicked in during the 1970s, and warming has been pretty steady since then.
While the overall warming is about 0.16 °C per decade, there are three ten-year periods where there was a hiatus in warming, as the graph above shows, from 1977 to 1986, from 1987 to 1996, and from 2001 to 2012. But at each end of these periods there were big jumps. We find exactly the same sort of flat periods in climate model projections, lasting easily up to 15 years in length.
Focusing on the wiggles and ignoring the bigger picture of unabated warming is foolhardy, but an approach promoted by climate change deniers. Global sea level keeps marching up at a rate of more than 30 cm per century since 1992 (when global measurements via altimetry on satellites were made possible), and that is perhaps a better indicator that global warming continues unabated. Sea level rise comes from both the melting of land ice, thus adding more water to the ocean, plus the warming and thus expanding ocean itself.
Global warming is manifested in a number of ways, and there is a continuing radiative imbalance at the top of atmosphere. The current hiatus in surface warming is temporary, and global warming has not gone away.http://climatecrocks.com/2013/06/01/the-weekend-wonk-trenberth-on-ocean-heat-and-surface-temps/
Thursday, May 23, 2013
Global warming is here to stay, whichever way you look at it
by Kevin Trenberth, University Corporation for Atmospheric Research, The Conversation, May 22, 2013Has global warming stalled? This question is increasingly being asked because the local weather seems cool and wet, or because the global mean temperature is not increasing at its earlier rate or the long-term rate expected from climate model projections.
The answer depends a lot on what one means by “global warming.” For some it is equated to the “global mean temperature.” That keeps going up but also has ups and downs from year to year. More on that shortly.
Why should it go up? Well, because the planet is warming as a result of human activities. With increasing carbon dioxide and other heat-trapping greenhouse gases in the atmosphere, there is an imbalance in energy flows in and out of the top of the atmosphere: the greenhouse gases increasingly trap more radiation and hence create warming. “Warming” really means heating, and this can exhibit itself in many ways.
Rising surface temperatures are just one manifestation. Melting Arctic sea ice is another. So is melting of glaciers and other land ice that contribute to rising sea levels. Increasing the water cycle and invigorating storms is yet another. But most (more than 90%) of the energy imbalance goes into the ocean, and several analyses have now shown this. But even there, how much warms the upper layers of the ocean, as opposed to how much penetrates deeper into the ocean where it may not have much immediate influence, is a key issue.
The ups and downs of global temperature
My colleagues and I have just published a new analysis showing that in the past decade about 30% of the heat has been dumped at levels below 700 meters, where most previous analyses stop.The first point is that this is fairly new; it is not there throughout the record. The cause of the shift is a particular change in winds, especially in the Pacific Ocean where the subtropical trade winds have become noticeably stronger, changing ocean currents and providing a mechanism for heat to be carried down into the ocean. This is associated with weather patterns in the Pacific, which are in turn related to the La Niña phase of the El Niño phenomenon.
The second point is that we have found distinctive variations in global warming with El Niño. A mini global warming, in the sense of a global temperature increase, occurs in the latter stages of an El Niño event, as heat comes out of the ocean and warms the atmosphere. The ocean’s temperature is also affected by volcanic eruptions, which also affect the perceptions of global warming.
Normal weather also interferes by generating clouds that reflect the sunshine, and there are fluctuations in the global energy imbalance from month to month. But these average out over a year or so.
Another prominent source of natural variability in the Earth’s energy imbalance is changes in the sun itself, seen most clearly as the sunspot cycle. From 2005 to 2010 the sun went into a quiet phase and the warming energy imbalance is estimated to have dropped by about 10 to 15%.
Some of the penetration of heat into the depths of the ocean is reversible, as it comes back in the next El Niño [whenever that is -- no signs of one for the rest of this year]. But a lot is not; instead it contributes to the overall warming of the deep ocean. This means less short-term warming at the surface, but at the expense of greater long-term warming, and faster sea level rise. So this has consequences.
Global warming is here to stay
Coming back to the global temperature record, one thing is clear. The past decade is by far the warmest on record. Human-induced global warming really kicked in during the 1970s, and warming has been pretty steady since then.
Focusing on the wiggles and ignoring the bigger picture of unabated warming is foolhardy, but an approach promoted by climate change deniers. Global sea level keeps marching up at a rate of more than 30 cm per century since 1992 (when global measurements via altimetry on satellites were made possible), and that is perhaps a better indicator that global warming continues unabated. Sea level rise comes from both the melting of land ice, thus adding more water to the ocean, plus the warming and thus expanding ocean itself.
Global warming is manifested in a number of ways, and there is a continuing radiative imbalance at the top of atmosphere. The current hiatus in surface warming is temporary, and global warming has not gone away.
Kevin Trenberth does not work for, consult to, own shares in or receive funding from any company or organisation that would benefit from this article, and has no relevant affiliations.

This article was originally published at The Conversation. Read the original article.
http://theconversation.com/global-warming-is-here-to-stay-whichever-way-you-look-at-it-14532
Thursday, May 9, 2013
Geophysical Research Letters, DOI: 10.1002/grl.50541
Strengthening of ocean heat uptake efficiency associated with the recent climate hiatus†
Abstract
http://0-onlinelibrary.wiley.com.library.hct.ac.ae/doi/10.1002/grl.50541/abstract
Open-access pdf file: http://0-onlinelibrary.wiley.com.library.hct.ac.ae/doi/10.1002/grl.50541/pdf
Strengthening of ocean heat uptake efficiency associated with the recent climate hiatus†
Abstract
The rate of increase of global-mean surface air temperature (SATg) has apparently slowed during the last decade. We investigated the extent to which state-of-the-art general circulation models (GCMs) can capture this hiatus period by using multi-model ensembles of historical climate simulations. While the SATg linear trend for the last decade is not captured by their ensemble means regardless of differences in model generation and external forcing, it is barely represented by an 11-member ensemble of a GCM, suggesting an internal origin of the hiatus associated with active heat uptake by the oceans. Besides, we found opposite changes in ocean heat uptake efficiency (κ), weakening in models and strengthening in nature, which explain why the models tend to overestimate the SATg trend. The weakening of κ commonly found in GCMs seems to be an inevitable response of the climate system to global warming, suggesting the recovery from hiatus in coming decades.
http://0-onlinelibrary.wiley.com.library.hct.ac.ae/doi/10.1002/grl.50541/abstract
Open-access pdf file: http://0-onlinelibrary.wiley.com.library.hct.ac.ae/doi/10.1002/grl.50541/pdf
Monday, May 6, 2013
'Climate scientists struggle to explain warming slowdown,' said Reuters. But warming is speeding up, and scientists can explain it 
Oceans, such as the Pacific pictured here from space, are absorbing much of the warming the planet is currently experiencing. NASA/ Roger Ressmeyer/ Corbis
The rate of heat building up on Earth over the past decade is equivalent to detonating about 4 Hiroshima atomic bombs per second. Take a moment to visualize 4 atomic bomb detonations happening every single second. That's the global warming that we're frequently told isn't happening.
There are periods when the ocean heats up more quickly than the surface, and other periods when the surface heats up more quickly than the oceans. Right now we're in a period of fast ocean warming and overall, global warming is continuing at a very fast pace. Average of NASA GISS, NOAA NCDC, and HadCRUT4 monthly global surface temperature anomalies from January 1970 through November 2012 (green) with linear trends applied to the time frames Jan 1970–Oct 1977, Apr 1977–Dec 1986, Sep 1987–Nov 1996, Jun 1997–Dec 2002, and Nov 2002–Nov 2012.
Oceans, such as the Pacific pictured here from space, are absorbing much of the warming the planet is currently experiencing. NASA/ Roger Ressmeyer/ Corbis
The rate of heat building up on Earth over the past decade is equivalent to detonating about 4 Hiroshima atomic bombs per second. Take a moment to visualize 4 atomic bomb detonations happening every single second. That's the global warming that we're frequently told isn't happening.
There are periods when the ocean heats up more quickly than the surface, and other periods when the surface heats up more quickly than the oceans. Right now we're in a period of fast ocean warming and overall, global warming is continuing at a very fast pace.
The confusion on this subject lies in the fact that only about 2% of global warming is used in heating air, whereas about 90% of global warming goes into heating the oceans (the rest heats ice and land masses). But humans live at the Earth's surface, and thus we tend to focus on surface temperatures. Over the past 10–15 years, Earth's surface temperature has continued to rise, but slowly. At the same time, the warming of the oceans – and the warming of the Earth as a whole – has accelerated.
This was the conclusion of a scientific paper I co-authored last year, in which our team found more overall global warming (of the oceans, air, land, and ice combined) over the past 15 years than during the prior 15 years. Just recently, another paper published in the journal Geophysical Research Letters found that the warming of the oceans since the turn of the century has been the most sustained in the past 50 years. They also found that, consistent with my team's research, about 30% of overall global warming has gone into the deep oceans below 700 meters due to changing wind patterns and ocean currents. This accelerated deep ocean warming is also unprecedented in the past 50 years.
We often hear from the media that the (surface air) warming has slowed or paused over the past 15 years. This isn't a puzzle; climate scientists are well aware of several contributing factors, as a recent Reuters article – "Climate scientists struggle to explain warming slowdown" – eventually discussed. The accelerated warming of the oceans is likely the main contributor.
During years with La Niña events, more heat is transferred to the oceans, and surface temperatures are relatively cool as a result. The opposite is true during El Niño years. During the 1990s, there were more El Niño than La Niña events, which resulted in more surface air warming. One of the strongest El Niño events of the century happened in 1998, which not coincidentally was 15 years ago.
When people say "no warming in 15 years," they're cherry picking the timeframe to begin in an abnormally hot year. It's like arguing that your car must have broken down because it hasn't moved in the 15 seconds while you've been stopped at a red light. The argument selects a short timeframe that's not representative of the whole.
Since 2000, there has been a preponderance of La Niña events, which has acted to temporarily bury more global warming in the oceans. A new study published in Nature Climate Change found that by taking into account the short-term changes caused by factors like El Niño and La Niña cycles, they could accurately forecast the slowed warming at the surface several years in advance. The paper concluded,
"Our results hence point at the key role of the ocean heat uptake in the recent warming slowdown."
Reuters did not talk to the authors of this study, or ask any other climate scientists about this surface warming slowdown that they're supposed to be puzzled about. Actually that's not quite true. Just a week earlier, Reuters interviewed the lead author of that paper in an article with the headline "Oceans may explain slowdown in climate change." The article noted,
"Experts in France and Spain said on Sunday that the oceans took up more warmth from the air around 2000. That would help explain the slowdown in surface warming but would also suggest that the pause may be only temporary and brief."
Reuters didn't connect the dots between these two articles, telling us one week that oceans help explain the surface warming slowdown, and the next week claiming the slowdown is puzzling climate scientists. However, these 'slowdowns' happen on a regular basis. You can find one every 5 to 10 years in the surface temperature data, as illustrated in a graphic I created nicknamed "The Escalator."
Average of NASA GISS, NOAA NCDC, and HadCRUT4 monthly global surface temperature anomalies from January 1970 through November 2012 (green) with linear trends applied to the time frames Jan 1970–Oct 1977, Apr 1977–Dec 1986, Sep 1987–Nov 1996, Jun 1997–Dec 2002, and Nov 2002–Nov 2012.During periods with more La Niñas, surface temperatures temporarily flatten out. But global warming does not. As long as humans continue to increase the greenhouse effect by burning massive quantities of fossil fuels, the planet will continue to warm, as is clear from the acceleration of global warming since 2000.
• This is the first post for my new blog with John Abraham, "Climate Consensus – the 97%," hosted by the Guardian. I'm also a writer for Skeptical Science, and an environmental scientist by trade. You can follow me on Twitter @dana1981.
Friday, April 26, 2013
There has been an unusual surge of interest in the climate sensitivity based on the last decade’s worth of temperature measurements, and a lengthy story in the Economist tries to argue that the climate sensitivity may be lower than previously estimated. I think its conclusion is somewhat misguided because it missed some important pieces of information (also see Skeptical Science’s take on this story here).
 While the Economist referred to some unpublished work, it missed a new paper by Balmaseda et al. (2013) which provides a more in-depth insight. Balmaseda et al. suggest that recent years may not have much effect on the climate sensitivity after all, and according to their analysis, it is the winds blowing over the oceans that may be responsible for the ‘slow-down’ presented in the Economist.
It is well-known that changes in temperature on decadal time scales are strongly influenced by natural and internal variations, and should not be confused with a long-term trend (Easterling & Wehner 2009, Foster & Rahmstorf 2011).
An intensification of the trades has affected surface ocean currents called the subtropical gyres, and these changes have resulted in a predominance of the La Nina state. The La Nina phase is associated with a lower global mean temperature than usual.
Balmaseda et al.’s results also suggested that a negative phase of the Pacific Decadal Oscillation (PDO) may have made an imprint on the most recent years. In addition, they found that the deep ocean has warmed over the recent years, while the upper 300 m of the oceans have ‘stabilised.’
The oceans can be compared to a battery that needs to be recharged after going flat. After the powerful 1997-98 El Nino, heat flowed out of the tropical oceans in order to heat the atmosphere (evaporative cooling) and the higher latitudes. The warming resumed after the ‘deflation,’ but something happened after 1998: since then, the warming has involved the deep ocean to a much greater extent. A weakening of the Atlantic Meridional Overturning Circulation (MOC) may have played a role in the deep ocean warming.
The recent changes in these decade-scale variations appear to have masked the real accumulation of heat on Earth.
The new knowledge from this paper, the way I read it, is the revelation of the role of winds for vertical mixing/diffusion of heat in a new analysis of the world oceans. Their results were derived through a set of different experiments testing the sensitivity to various assumptions and choices made for data inclusion and the ocean model assimilation set-up.
The analysis involved a brand new ocean analysis (ORAS4, Balmaseda et al. 2013) based on an optimal use of observations, data assimilation, and an ocean model forced with state-of-the-art description of the atmosphere (reanalyses).
By running a set of different experiments with the ocean model, including different conditions, such as surface winds and different types of data, they explored which influence the different conditions have on their final conclusion.
The finding that the winds play a role for the state of the warming may not be surprising to oceanographers, although it may not necessarily be the first thing a meteorologist may consider.
http://www.realclimate.org/index.php/archives/2013/04/the-answer-is-blowing-in-the-wind-the-warming-went-into-the-deep-end/#more-15062
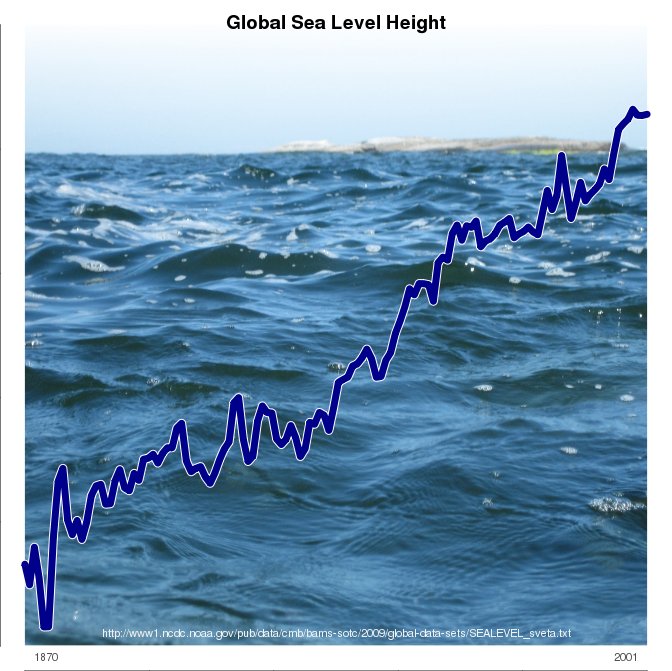
The ocean heat content and the global mean sea level height have marched on.
It is well-known that changes in temperature on decadal time scales are strongly influenced by natural and internal variations, and should not be confused with a long-term trend (Easterling & Wehner 2009, Foster & Rahmstorf 2011).
An intensification of the trades has affected surface ocean currents called the subtropical gyres, and these changes have resulted in a predominance of the La Nina state. The La Nina phase is associated with a lower global mean temperature than usual.
Balmaseda et al.’s results also suggested that a negative phase of the Pacific Decadal Oscillation (PDO) may have made an imprint on the most recent years. In addition, they found that the deep ocean has warmed over the recent years, while the upper 300 m of the oceans have ‘stabilised.’
The oceans can be compared to a battery that needs to be recharged after going flat. After the powerful 1997-98 El Nino, heat flowed out of the tropical oceans in order to heat the atmosphere (evaporative cooling) and the higher latitudes. The warming resumed after the ‘deflation,’ but something happened after 1998: since then, the warming has involved the deep ocean to a much greater extent. A weakening of the Atlantic Meridional Overturning Circulation (MOC) may have played a role in the deep ocean warming.
The recent changes in these decade-scale variations appear to have masked the real accumulation of heat on Earth.
The new knowledge from this paper, the way I read it, is the revelation of the role of winds for vertical mixing/diffusion of heat in a new analysis of the world oceans. Their results were derived through a set of different experiments testing the sensitivity to various assumptions and choices made for data inclusion and the ocean model assimilation set-up.
The analysis involved a brand new ocean analysis (ORAS4, Balmaseda et al. 2013) based on an optimal use of observations, data assimilation, and an ocean model forced with state-of-the-art description of the atmosphere (reanalyses).
By running a set of different experiments with the ocean model, including different conditions, such as surface winds and different types of data, they explored which influence the different conditions have on their final conclusion.
The finding that the winds play a role for the state of the warming may not be surprising to oceanographers, although it may not necessarily be the first thing a meteorologist may consider.
http://www.realclimate.org/index.php/archives/2013/04/the-answer-is-blowing-in-the-wind-the-warming-went-into-the-deep-end/#more-15062
Subscribe to:
Posts (Atom)


