TheNextGeneration

  • Subscribe to our RSS feed.
  • Twitter
  • StumbleUpon
  • Reddit
  • Facebook
  • Digg
Showing posts with label PDO - Pacific Decadal Oscillation. Show all posts

Wednesday, September 4, 2013

Dana Nuccitelli: The Pacific Ocean fills in another piece of the global warming puzzle

Posted on 8:03 AM by Unknown
Evidence continues to mount that the slowed warming of global surface temperatures is mainly due to changes in the oceans

by Dana Nuccitelli, Climate Consensus - The 97%, The Guardian, September 3, 2013

A new study published in the journal Nature incorporates temperature changes in the tropical Pacific Ocean into an advanced climate model, and finds that the model can reproduce observed global surface temperature changes remarkably well.

This graph shows the good match between model temperatures in the last few decades (in red) and measured temperatures (in black). Just accounting for radiative changes doesn't reproduce the recent surface warming slowdown (in purple).  
This graph shows the good match between temperatures in the Nature paper model (in red) and measured temperatures (in black). Just accounting for human and solar climate influences doesn't reproduce the recent surface warming slowdown (in purple). 
  Importantly, as authors Yu Kosaka and Shang-Ping Xie from the Scripps Institution of Oceanography explain, accounting for the changes in the Pacific Ocean allows the model to reproduce the slowed global surface warming over the past 15 years. It also accurately reproduces the regional and seasonal changes in surface temperatures, which adds confidence that their results are meaningful.
Our results show that the current hiatus is part of natural climate variability, tied specifically to La-Niña-like decadal cooling … For the recent decade, the decrease in tropical Pacific sea surface temperature has lowered the global temperature by about 0.15 degrees Celsius compared to the 1990s.
Despite only covering 8.2% of the Earth's surface, these results suggest that the tropical Pacific Ocean plays a major role in short-term changes in the average global surface temperature. And over the past 15 years, it's offset most of the global surface warming from the increased greenhouse effect.

These results are broadly consistent with several other important recent papers investigating the role of the oceans in global warming. For example, the model used in this study finds that the overall heating of the planet has not slowed when the warming of the oceans are taken into account, as studies led by John Abraham, myself, and several others have also concluded.
Research led by Gerald Meehl has similarly focused on the importance of the Pacific Ocean in short-term global surface temperature changes. His climate model predicts that there will be decades when surface temperature changes are relatively flat because more heat is transferred to the deep oceans, precisely as we have observed over the past decade. Meehl discussed the Kosaka & Xie study with Carbon Brief,
This paper basically confirms, with a novel methodology, what we originally documented in our Nature Climate Change paper in 2011 and followed up with in our Journal of Climate paper ... We went beyond [the new paper] to show that when the tropical Pacific was cool for a decade ... more heat is mixed into the deeper ocean, something the new paper doesn't address.
Kevin Trenberth, who co-authored several of these important ocean studies, has likewise pointed to the important role of the Pacific Ocean in transferring more heat to the deep oceans.
The cause of the shift is a particular change in winds, especially in the Pacific Ocean where the subtropical trade winds have become noticeably stronger, changing ocean currents and providing a mechanism for heat to be carried down into the ocean. This is associated with weather patterns in the Pacific, which are in turn related to the La Niña phase of the El Niño phenomenon.
Research by Masahiro Watanabe of the Japanese Atmosphere and Ocean Research Institute has also suggested that the transfer of heat to the deep oceans and corresponding slowed global surface warming is related to changes in the Pacific.
Thus the scientific picture is becoming increasingly clear that the Pacific Ocean has played a large role in the slowed surface warming in recent years, but the warming of the oceans and planet as a whole have continued unabated. Thus the slowed surface warming is very likely to be a temporary effect, similar to the flat global surface temperatures between 1940 and 1970 when the Pacific Ocean was in another cool cycle.

Although it may be a natural reaction to hope that the recent slowed surface warming suggests that climate change isn't an imminent threat, the scientific evidence simply does not support such optimism. Climate scientist Judith Curry, who I recently criticized for failing to grasp the concept of climate risk management, recently articulated this rosy view on her blog. By focusing at the model simulation data specifically from 1975 to 1998, Curry incorrectly argued that the study supports the position that global warming is mostly natural.

There are a few major problems with this argument. Between 1975 and 1998 when the Pacific Ocean was in a warm phase of its cycle, it accounted for some of the observed global surface warming (though less than Curry asserts; about 30%). But the thing about cycles – they're cyclical. Focusing on the warm cycles while ignoring the cool cycles is an example of classic cherry picking.

If we look at the full record, for both 1950–2012 and 1970–2012 (the Pacific Ocean temperature data are most reliable since 1970), according to the model used in this study, the Pacific Ocean has actually had a slight overall cooling effect on global surface temperatures. It's also important to note that this cycle is just moving heat around between oceans and air – the overall warming of the planet has remained steady and rapid.

Thus the body of scientific research consistently shows that global warming continues unabated, and is predominantly human-caused. The Pacific Ocean has likely played a significant role in the slowed global surface warming over the past 15 years by transferring more heat to the deep oceans, but that change appears to be a temporary one. When the Pacific Ocean enters its next warm cycle, we're likely to see a rapid warming of global surface temperatures. If we continue to use the temporary slowed surface warming as an excuse to delay climate action, we'll regret that decision when the surface warming kicks in with a vengeance.

http://www.theguardian.com/environment/climate-consensus-97-per-cent/2013/sep/03/global-warming-pacific-ocean-puzzle-piece
Read More
Posted in Dana Nuccitelli, ENSO, Gerald Meehl, John Abraham, Judith Curry, Kevin Trenberth, ocean heat content, PDO - Pacific Decadal Oscillation | No comments

Thursday, May 23, 2013

MORE MUST READ TIDBITS: Kevin Trenberth on ocean heat content, changing trade winds, mechanism for heat to be carried down deeper in the ocean

Posted on 8:43 PM by Unknown

Global warming is here to stay, whichever way you look at it

by Kevin Trenberth, University Corporation for Atmospheric Research, The Conversation, May 22, 2013

Has global warming stalled? This question is increasingly being asked because the local weather seems cool and wet, or because the global mean temperature is not increasing at its earlier rate or the long-term rate expected from climate model projections.

The answer depends a lot on what one means by “global warming.” For some it is equated to the “global mean temperature.” That keeps going up but also has ups and downs from year to year. More on that shortly.

Why should it go up? Well, because the planet is warming as a result of human activities. With increasing carbon dioxide and other heat-trapping greenhouse gases in the atmosphere, there is an imbalance in energy flows in and out of the top of the atmosphere: the greenhouse gases increasingly trap more radiation and hence create warming. “Warming” really means heating, and this can exhibit itself in many ways.

Rising surface temperatures are just one manifestation. Melting Arctic sea ice is another. So is melting of glaciers and other land ice that contribute to rising sea levels. Increasing the water cycle and invigorating storms is yet another. But most (more than 90%) of the energy imbalance goes into the ocean, and several analyses have now shown this. But even there, how much warms the upper layers of the ocean, as opposed to how much penetrates deeper into the ocean where it may not have much immediate influence, is a key issue.

The ups and downs of global temperature

My colleagues and I have just published a new analysis showing that in the past decade about 30% of the heat has been dumped at levels below 700 meters, where most previous analyses stop.

The first point is that this is fairly new; it is not there throughout the record. The cause of the shift is a particular change in winds, especially in the Pacific Ocean where the subtropical trade winds have become noticeably stronger, changing ocean currents and providing a mechanism for heat to be carried down into the ocean. This is associated with weather patterns in the Pacific, which are in turn related to the La Niña phase of the El Niño phenomenon.

The second point is that we have found distinctive variations in global warming with El Niño. A mini global warming, in the sense of a global temperature increase, occurs in the latter stages of an El Niño event, as heat comes out of the ocean and warms the atmosphere. The ocean’s temperature is also affected by volcanic eruptions, which also affect the perceptions of global warming.

Normal weather also interferes by generating clouds that reflect the sunshine, and there are fluctuations in the global energy imbalance from month to month. But these average out over a year or so.

Another prominent source of natural variability in the Earth’s energy imbalance is changes in the sun itself, seen most clearly as the sunspot cycle. From 2005 to 2010 the sun went into a quiet phase and the warming energy imbalance is estimated to have dropped by about 10 to 15%.

Some of the penetration of heat into the depths of the ocean is reversible, as it comes back in the next El Niño [whenever that is -- no signs of one for the rest of this year]. But a lot is not; instead it contributes to the overall warming of the deep ocean. This means less short-term warming at the surface, but at the expense of greater long-term warming, and faster sea level rise. So this has consequences.

Global warming is here to stay

Coming back to the global temperature record, one thing is clear. The past decade is by far the warmest on record. Human-induced global warming really kicked in during the 1970s, and warming has been pretty steady since then.

While the overall warming is about 0.16 °C per decade, there are three 10-year periods where there was a hiatus in warming, as the graph above shows, from 1977 to 1986, from 1987 to 1996, and from 2001 to 2012. But at each end of these periods there were big jumps. We find exactly the same sort of flat periods in climate model projections, lasting easily up to 15 years in length.

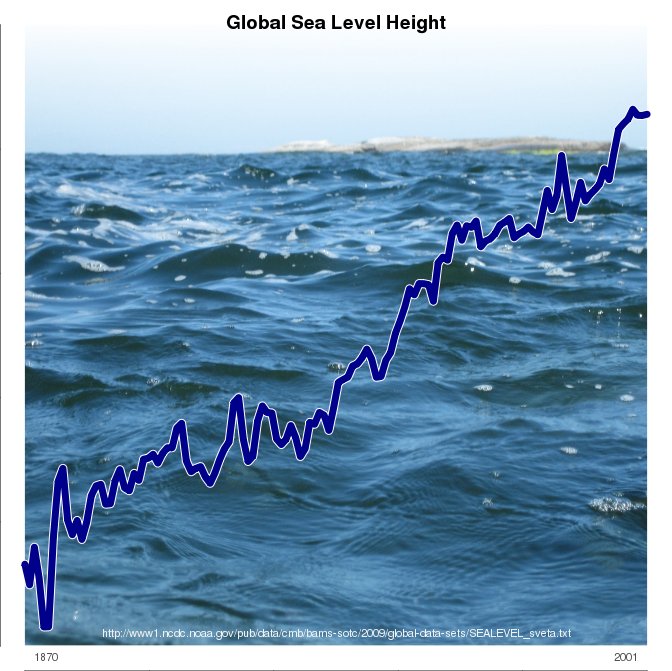
Focusing on the wiggles and ignoring the bigger picture of unabated warming is foolhardy, but an approach promoted by climate change deniers. Global sea level keeps marching up at a rate of more than 30 cm per century since 1992 (when global measurements via altimetry on satellites were made possible), and that is perhaps a better indicator that global warming continues unabated. Sea level rise comes from both the melting of land ice, thus adding more water to the ocean, plus the warming and thus expanding ocean itself.

Global warming is manifested in a number of ways, and there is a continuing radiative imbalance at the top of atmosphere. The current hiatus in surface warming is temporary, and global warming has not gone away.

Kevin Trenberth does not work for, consult to, own shares in or receive funding from any company or organisation that would benefit from this article, and has no relevant affiliations.

The Conversation
This article was originally published at The Conversation. Read the original article.

http://theconversation.com/global-warming-is-here-to-stay-whichever-way-you-look-at-it-14532
Read More
Posted in ENSO, Kevin Trenberth, ocean heat content, Ocean temperatures, PDO - Pacific Decadal Oscillation, Sea level rise, Solar activity, volcanism | No comments

Friday, April 26, 2013

RealClimate: The answer is blowing in the wind: The warming went into the deep end [of the oceans]

Posted on 8:53 AM by Unknown
by rasmus, RealClimate, April 26, 2013
 
There has been an unusual surge of interest in the climate sensitivity based on the last decade’s worth of temperature measurements, and a lengthy story in the Economist tries to argue that the climate sensitivity may be lower than previously estimated. I think its conclusion is somewhat misguided because it missed some important pieces of information (also see Skeptical Science’s take on this story here).

The ocean heat content and the global mean sea level height have marched on.
 
While the Economist referred to some unpublished work, it missed a new paper by Balmaseda et al. (2013) which provides a more in-depth insight. Balmaseda et al. suggest that recent years may not have much effect on the climate sensitivity after all, and according to their analysis, it is the winds blowing over the oceans that may be responsible for the ‘slow-down’ presented in the Economist.

It is well-known that changes in temperature on decadal time scales are strongly influenced by natural and internal variations, and should not be confused with a long-term trend (Easterling & Wehner 2009, Foster & Rahmstorf 2011).

An intensification of the trades has affected surface ocean currents called the subtropical gyres, and these changes have resulted in a predominance of the La Nina state. The La Nina phase is associated with a lower global mean temperature than usual.

Balmaseda et al.’s results also suggested that a negative phase of the Pacific Decadal Oscillation (PDO) may have made an imprint on the most recent years. In addition, they found that the deep ocean has warmed over the recent years, while the upper 300 m of the oceans have ‘stabilised.’ 
 
The oceans can be compared to a battery that needs to be recharged after going flat. After the powerful 1997-98 El Nino, heat flowed out of the tropical oceans in order to heat the atmosphere (evaporative cooling) and the higher latitudes. The warming resumed after the ‘deflation,’ but something happened after 1998: since then, the warming has involved the deep ocean to a much greater extent. A weakening of the Atlantic Meridional Overturning Circulation (MOC) may have played a role in the deep ocean warming.

The recent changes in these decade-scale variations appear to have masked the real accumulation of heat on Earth.

The new knowledge from this paper, the way I read it, is the revelation of the role of winds for vertical mixing/diffusion of heat in a new analysis of the world oceans. Their results were derived through a set of different experiments testing the sensitivity to various assumptions and choices made for data inclusion and the ocean model assimilation set-up.

The analysis involved a brand new ocean analysis (ORAS4, Balmaseda et al. 2013) based on an optimal use of observations, data assimilation, and an ocean model forced with state-of-the-art description of the atmosphere (reanalyses).

By running a set of different experiments with the ocean model, including different conditions, such as surface winds and different types of data, they explored which influence the different conditions have on their final conclusion.

The finding that the winds play a role for the state of the warming may not be surprising to oceanographers, although it may not necessarily be the first thing a meteorologist may consider.

http://www.realclimate.org/index.php/archives/2013/04/the-answer-is-blowing-in-the-wind-the-warming-went-into-the-deep-end/#more-15062
Read More
Posted in Atlantic Meridional Overturning Circulation - AMOC, ENSO, ocean heat content, PDO - Pacific Decadal Oscillation, Stefan Rahmstorf | No comments

Tuesday, March 26, 2013

The characteristics and likely causes of the Medieval megadroughts in North America

Posted on 9:39 PM by Unknown


by Richard Seager, Celine Herweijer and Ed Cook
Lamont-Doherty Earth Observatory of Columbia University
Severe though the six multi-year droughts since the mid nineteenth century have been in terms of environmental and social impacts, as climate events they were dwarfed by a series of megadroughts that struck the West between about 900 and 1400 AD. These droughts were sufficiently long in duration that it actually makes more sense to describe the Medieval climate of the West as not so much afflicted by a sequence of droughts but as simply more arid than in subsequent centuries or now.
The visual evidence of medieval megadroughts in the landscape today
The medieval droughts were long before the beginning of instrumental weather records and their character and severity must be reconstructed from the signature they left within the environment. One of the most dramatic of these is frequently seen by travelers in the mountains states of the West who probably rarely understand what they are seeing. Dead tree stumps, seasonally flooded by water, are often seen in river valley bottoms in the Sierra Nevada and they also populate the underwater margins of famous lakes such as Mono Lake. In the early 1990s Scott Stine, a University of California geographer, began using carbon dating to determine when these trees were living and found that they pretty much all grouped in the medieval period. See Scott Stine's article at www.yosemite.org. The trees were living in river valleys and around lakes that, because the climate was drier, never flooded. When the medieval megadrought period ended, waters rose and the trees died. Elsewhere in the high plains of Nebraska and elsewhere the medieval megadroughts can still be seen as massive sand dunes that are now grassed over and stable.
In a remarkable paper ("Late Quaternary bison population changes on the southern Plains," Plains Anthropologist, 19 (1974) 180-196), Tom Dillehay successfully sketched the medieval climatological history of the southern Great Plains based on little more than the numbers of bison bones found in archaeological sites. At this time few Indians were dependent on bison hunting -- that was yet to come when European expanded into the moister areas to the east and displaced Indians from areas where they both farmed and hunted. In Dillehay's study it is striking how few were the bison remains a millennium ago compared to the periods before and after. He also drew what now appears the correct conclusion -- the climate was drier and bison populations shrank as grasslands became desert.
The medieval megadroughts may also have left their signature on the human environment of the West. The great cliff cities in the four corners region of the West such as at Chaco Canyon and Mesa Verde were all abandoned towards the end of the drought. These societies were based on irrigated agriculture. Although there remains much debate about why these highly organized Indian societies collapsed archaeologists are revisiting the idea that decades of dry conditions were part of the reason (see Jones et al., "Environmental Imperatives Reconsidered: Demographic Crises in Western North America during the Medieval Climate Anomaly," Current Anthropogy, April 1999). By the time wetter conditions returned, the Spaniards had also arrived and probably prevented Indians from reestablishing irrigation-based complex urban societies.
Tree ring records of the spatial extent, severity and duration of droughts
The best record of the droughts come from the width of annual growth rings of long lived trees. Correlation of modern day ring widths with weather records has demonstrated that the ring width is strongly related to summer values of the so-called Palmer Drought Severity Index or PDSI. The PDSI was developed as a simple measure of the moisture content of soil in the root zone. It makes sense that the tree ring width would correlate with this during summer since that is the growth season. Analysis of ring widths from living trees that have lived in North America for as long as two millennia, together with plenty of complex statistics, allows preparation of maps of summer PDSI for each year from 2 BC to now. This data set was developed at the Tree Ring Laboratory at Lamont-Doherty Earth Observatory and is called the North American Drought Atlas (NADA). For the early centuries the coverage is limited to areas of the West with very long lived trees but by the beginning of the medieval droughts the coverage is pretty much all of the current United States.
In 2004, Ed Cook, of the LDEO Tree Ring Lab, published the first results from the NADA. One figure, reproduced here (Figure 1), of the percentage of the American West at any time effected by severe drought made a clear case for elevated aridity during the medieval period. For several hundred years up until the 15th century well over half the area routinely experienced severe drought at any time. The centuries to follow -- broadly coincident with the Little Ice Age period of a colder climate in Europe -- was wetter. There is a hint that we have been returning to a more arid climate since the beginning of the 19th century.
Figure 1
Top, the percent of the area of the American West experiencing moderate to severe drought at any one time as reconstructed from tree ring records over the last millennium. The time series has been filtered to emphasize variations on timescales of many decades to centuries. The lower panel shows a blowup for the last century emphasizing that the recent drought was not historically exceptional. The figure is taken from Cook et al. (2004, Science). During Medieval times serious drought affected large areas of the West. Following that there was a long period of more moderate drought (corresponding to the Little Ice Age) and, since then there appears to have been a return to a more drought stricken climate.

figure1

Tree ring records of modern droughts
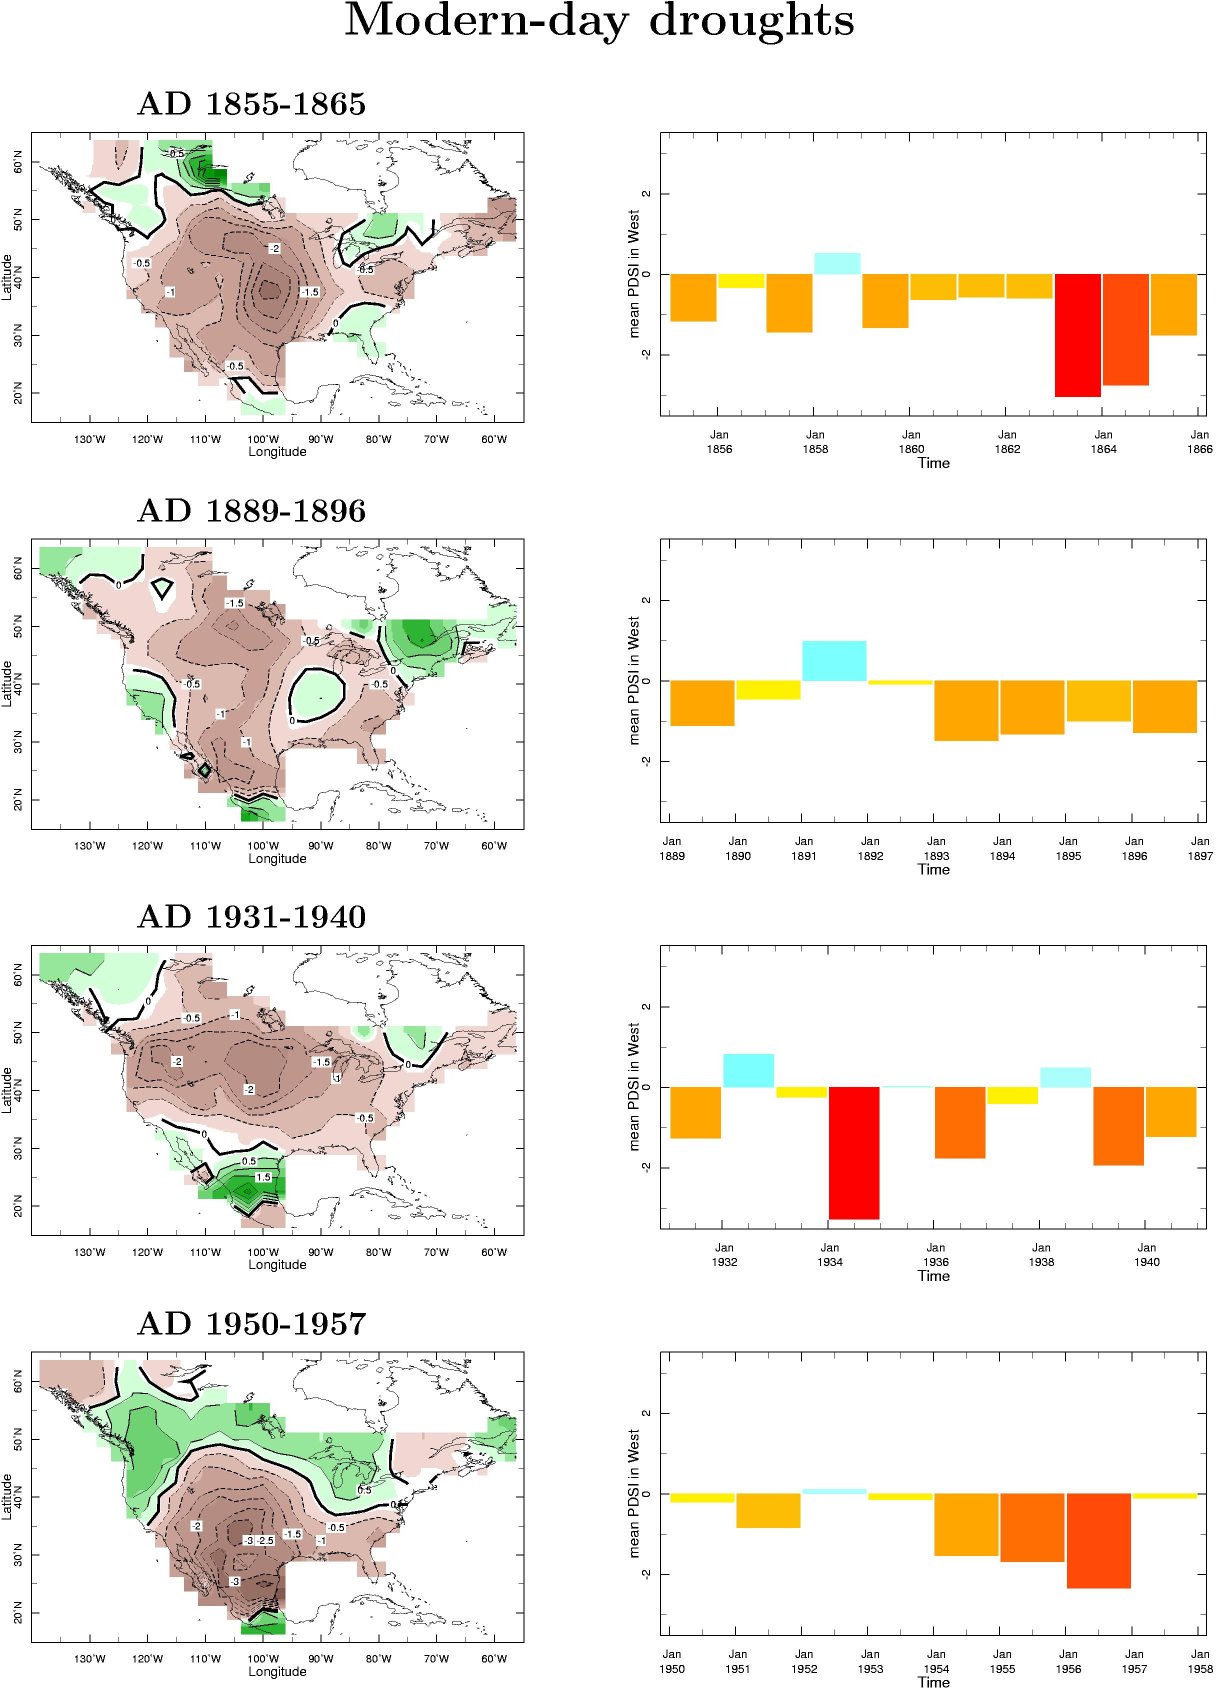
In the last year a collaboration between the Tree Ring Lab and the Climate Modeling and Diagnostics Group at LDEO has allowed a closer look at the tree ring records of drought. Figure 2 shows the summer PDSI reconstructed from the tree ring records for the modern day droughts as well as time series of the PDSI averaged over a region defined as the American West (25 N to 50 N and 125 W to 95 W) for the years covered by the droughts. By comparison to instrumental records, it is clear that the tree ring growths faithfully record the droughts. Each drought effected much of North America from the Appalachians to the Pacific coast and from the northern Mexico and the Gulf Coast into Canada. Each was also associated with weak tendencies to wetter conditions in the Pacific Northwest, maritime eastern Canada and southern Mexico. In the year by year evolution the multiyear droughts were made up of years of severe drought interrupted by more modest years and the occasional wet years. None appear monolithic in having dry conditions year after year after year although the Civil War drought comes closest to this.
Figure 2
Tree ring records of modern droughts. The spatial distribution of tree ring summer Palmer Drought Severity Index (PDSI) is at left and the PDSI averaged over the West is at right.

figure2

Spatial patterns of tree ring records of drought and related ocean conditions
Figure 3 shows the results of an analysis, by Rotated Empirical Orthogonal Functions (REOF), of the spatial patterns of the tree ring records of droughts during the modern period. The first pattern, which explains 32% of the total variance, well describes the observed droughts in covering most of the United States with weak opposite-signed regions in the northwest and northeast. The second and third patterns would better describe droughts more localized in the east and west of the continent.
Figure 3
Summer drought patterns from tree rings for the period 1000-2003 AD as estimated from Rotated Empirical Orthogonal Analysis. The fraction of the total variance explained by each REOF is indicated. According to Preisendorfer's Rule N (bottom right) these three patterns are physically distinct.

figure3

The patterns of sea surface temperature (SST) and sea level pressure (SLP) associated with these patterns can be reconstructed via linear regression onto the time series of the relevant REOF. This is shown in Figure 4. The first, dominant mode, is correlated with a La Niña-like SST and SLP pattern: cold in the tropical Pacific Ocean with warm anomalies in the mid-latitude Pacific, a cold Indian Ocean and a seesaw of SLP between the eastern and western hemispheres. The other two patterns do not seem to be linked into coherent and known patterns of ocean variability. The second pattern could, however, be related to the North Atlantic Oscillation.
Figure 4
The SST (left) and SLP (right) patterns associated with the first three REOF patterns of drought evaluated on the 1856-2003 period. Pattern 1 if a typical decadal La-Niña-like pattern. Pattern 2 could be the summer North Atlantic Oscillation. The third drought pattern does not seem to be related to any clear mode of SST variation. These results support our modeling work of the 1856 to current period in that tropical Pacific influence dominates but that there may be a secondary Atlantic influence too.

figure4

These results support our modeling work of the 1856 to current period in that tropical Pacific influence dominates but that there may be a secondary Atlantic influence too
Tree ring records of medieval droughts
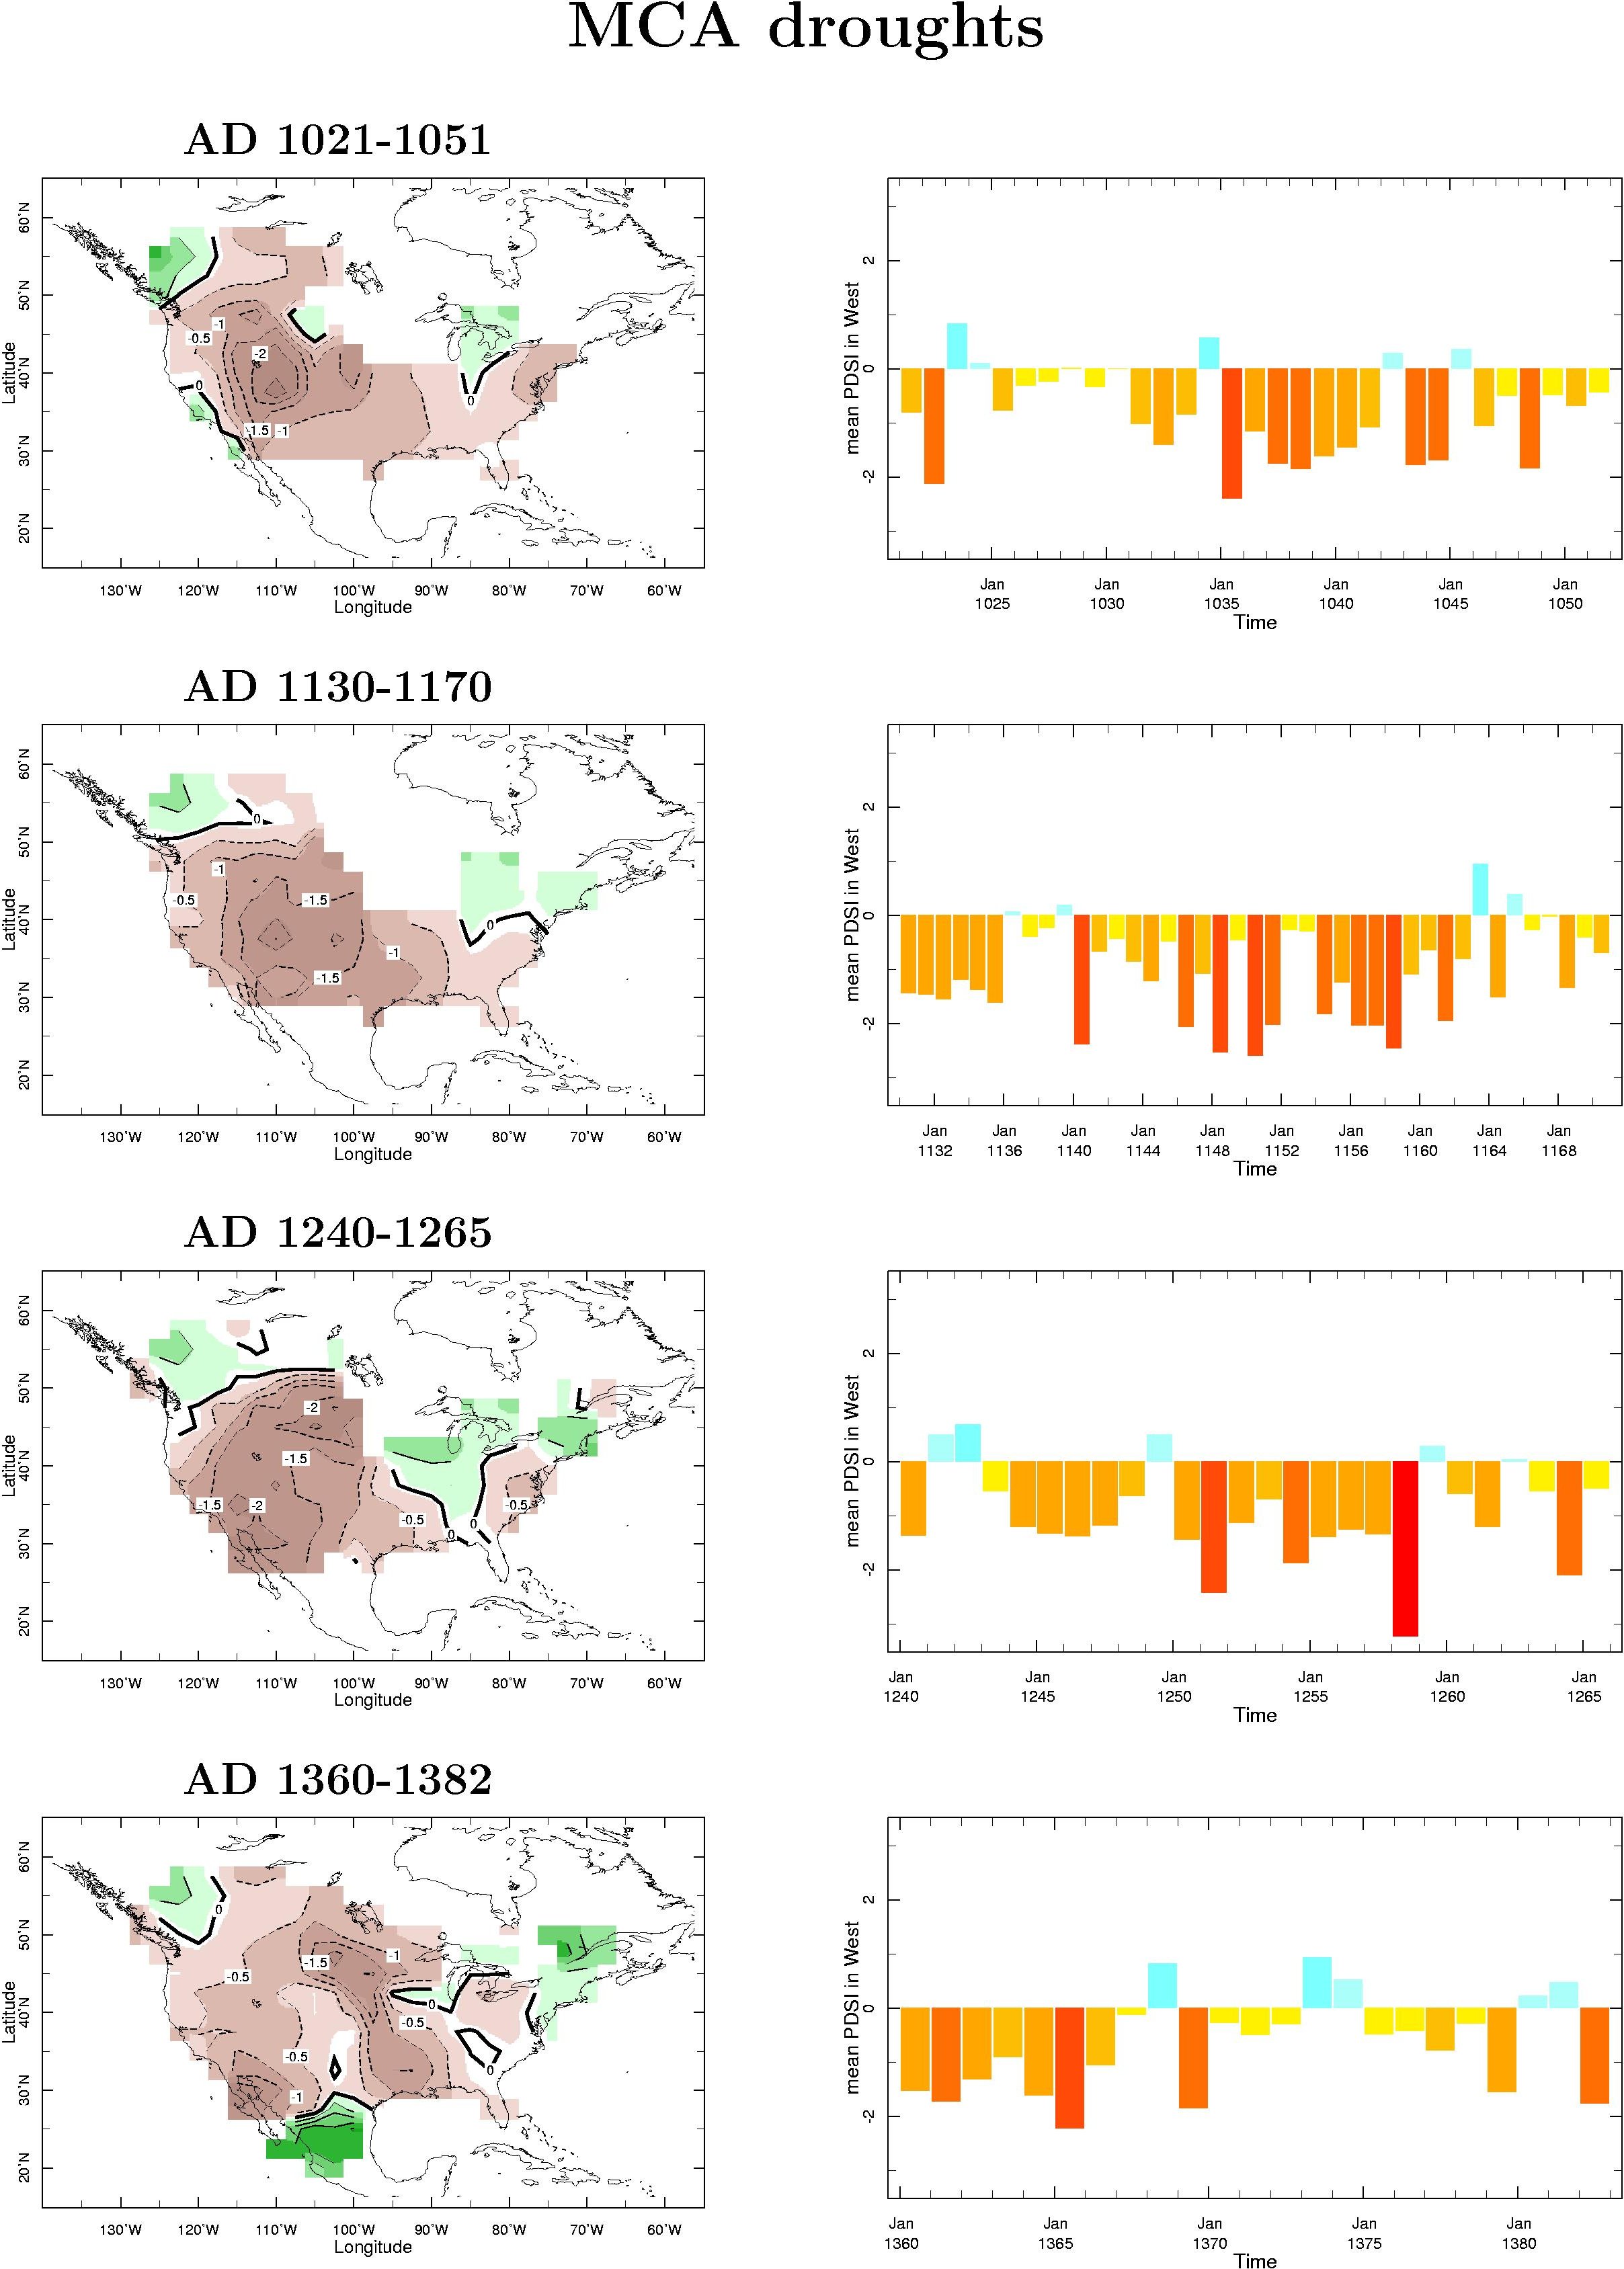
Figure 5 shows the spatial patterns and histories for a collection of medieval megadroughts. (Note that the time series in this figure extends over a much longer period of time than for the modern drought figure above.) Compared to the figures for the modern droughts what is remarkable is how similar the spatial pattern of the medieval droughts is to those with which we are familiar from experience and the instrumental record. The severity of drought in any year was also similar to that of a modern day drought. It is the year to year persistence of the medieval droughts that is different. Years as dry as 1936 or 1939 during the Dust Bowl drought frequently occurred year after year, and often with no break, (e.g., between 1140 and 1165) during medieval times.
Figure 5
Tree ring records of some medieval droughts. Spatial distribution is at left and the time history at right.

figure5

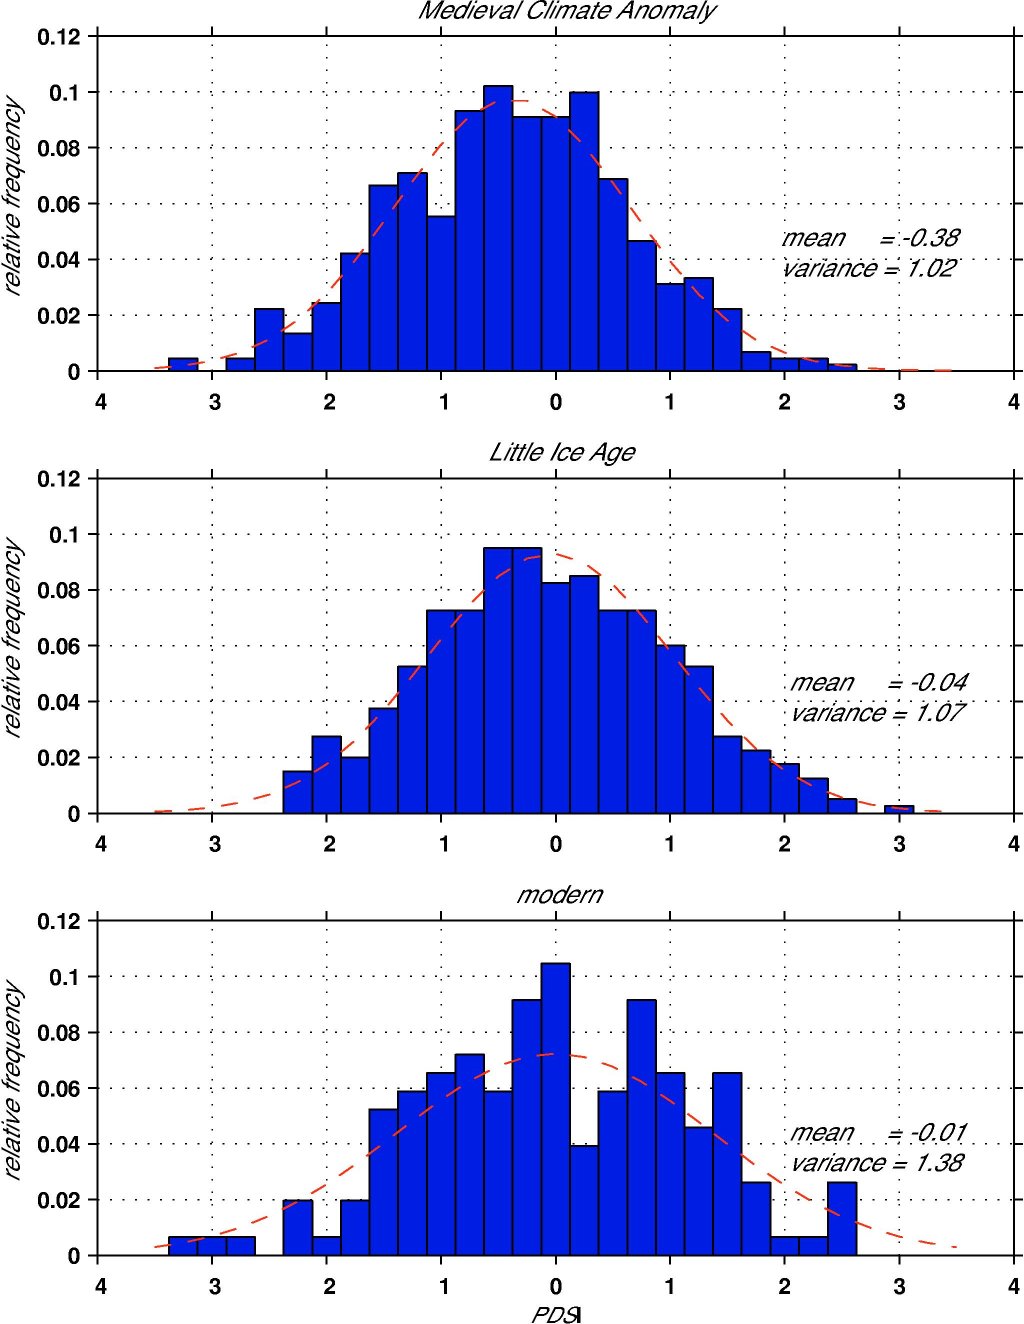
The year-to-year variability of drier and wetter conditions still occurred during the medieval period, albeit about a drier mean state. This is shown in Figure 6. Since ENSO currently influences such interannual variability this suggests that ENSO was operative then as now.
Figure 6
Histograms of annual summer tree ring derived PDSI for (top) the medieval period (or medieval climate anomaly (MCA)), (middle) the Little Ice Age and (bottom) the modern, post 1856, period.

figure6

These results suggest three obvious conclusions:
  1. The similarity of the spatial patterns suggests that the physical processes that caused the modern droughts also caused the medieval megadroughts.
  2. The global atmosphere ocean conditions that currently cause modern droughts for a few years at a time were the prevailing ocean climate during the medieval period.
  3. Despite the shift in the mean tropical ocean climate ENSO variability continued as now but oscillating about a colder mean state.
The global pattern of medieval hydroclimate
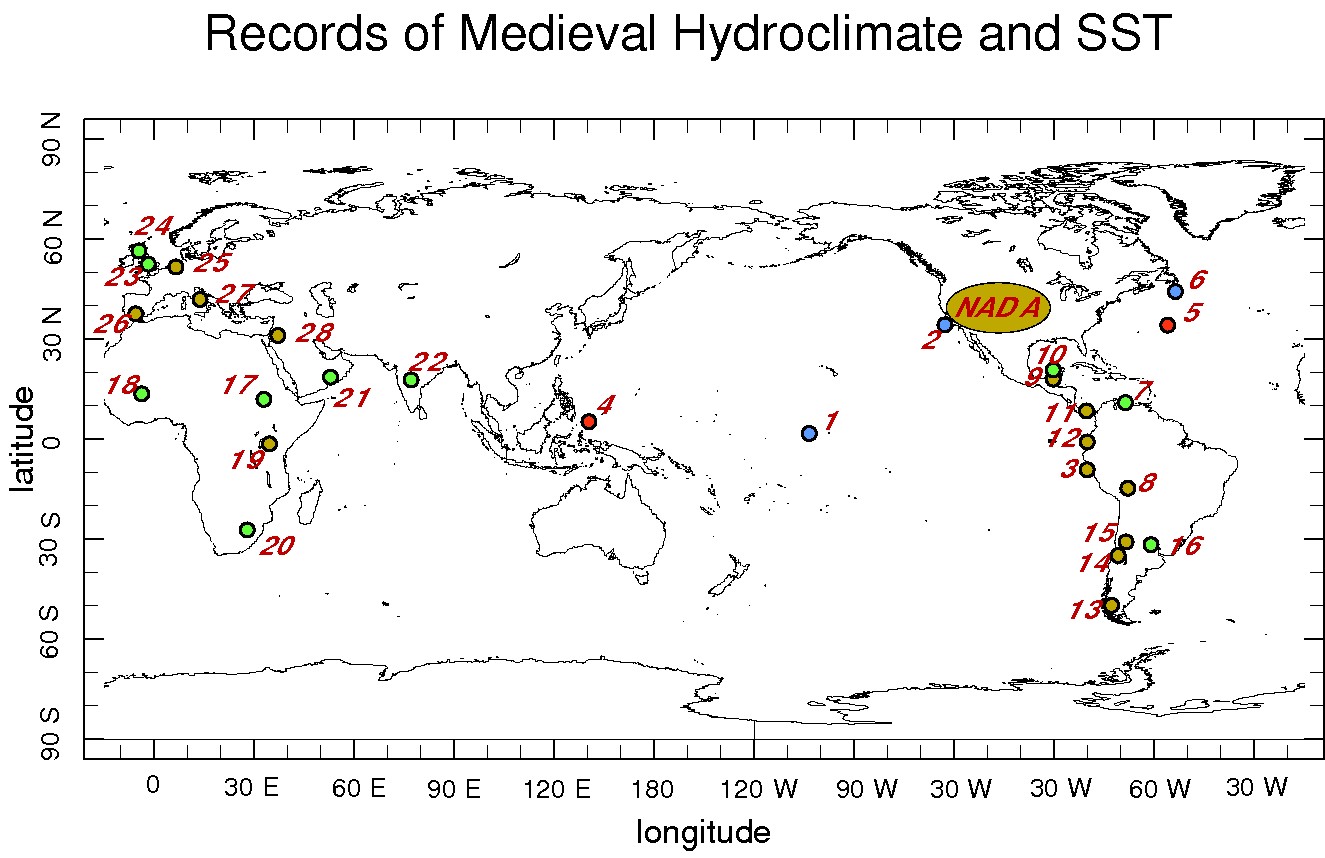
If a cooler tropical Pacific Ocean was the cause of the medieval megadroughts then, analogous to the historical period, we would also expect the climate to have been drier in southern South America, wetter in northern South America and Central America, wetter in the Sahel region of Africa but drier in coastal east Africa and drier in parts of the Mediterranean and southern Europe. There should also be evidence of colder ocean temperatures in the tropical Pacific. Figure 7 shows a compilation of proxy evidence (from trees, lake records, Nile flow records, ocean sediments, etc.) for hydroclimate conditions during the medieval period. Broadly speaking, the evidence of wet and dry conditions fits into the global pattern of hydroclimate change established for the historical period using satellite data, instrumental records and climate models. One of the more intriguing records comes from records of Nile flow. This tends to be low during El Niño events as rainfall is reduced over the headwaters of the White Nile. Therefore La Niña conditions tend to support high Nile flow. In a 1993 paper analyzing the Nile records, Quinn shows that low flows were only half as common during the medieval period as they were during the subsequent Little Ice Age!
Figure 7
Proxy evidence for medieval hydroclimate. Brown indicates a proxy indicator of dry conditions and green an indicator of wet conditions. The pattern resembles that of the global hydroclimate associated with modern day North American droughts.

figure7

For the tropical Pacific Ocean itself there is only one published record of reconstructed ocean temperatures -- based on the geochemistry of corals found on the island of Palmyra and analyzed by Kim Cobb, see web page. She interprets her data to indicate a colder tropical Pacific ocean during the periods of the medieval epoch for which she has data. Consequently, despite considerable limitations of the proxy evidence, to date it does support the idea that, during medieval times, the global hydroclimate tended towards what we would now call a La Niña-like state.
A first attempt to use the coral data to try to model the megadroughts can be found here.
References at link:  http://www.ldeo.columbia.edu/res/div/ocp/drought/medieval.shtml
Read More
Posted in Drought, ENSO, Medieval Climate Anomaly, PDO - Pacific Decadal Oscillation | No comments
Older Posts Home
Subscribe to: Posts (Atom)

Popular Posts

  • James Hansen: Tar Sands and Dirty Tricks
    by James Hansen, September 13, 2013 The New Yorker just published (16 September issue) an excellent article "The President and the Pip...
  • Andrew Glikson: Another link between CO2 and mass extinctions of species
    by Andrew Glikson , The Conversation , March 22, 2013 It’s long been known that massive increases in emission of CO 2 from volcanoes, assoc...
  • Bombshell: Recent Warming Is ‘Amazing And Atypical’ And Poised To Destroy Stable Climate That Enabled Civilization
    by Joe Romm , Climate Progress , March 8, 2013 New Science Study Confirms ‘Hockey Stick’: The Rate Of Warming Since 1900 Is 50 Times Greater...
  • Real Pragmatism for Real Climate Change: Interview with Dr. John Abraham
    by John Stafford, OilPrice.com, March 26, 2013 At a time when extreme weather incidents are causing billions in damages, businesses, governm...
  • Steve Horn: State Dept Keystone XL Enironmental Reviewer Claimed Delaware Tar Sands Refinery Made Air Cleaner
    by Steve Horn, DeSmogBlog, July 18, 2013 A  DeSmogBlog  investigation reveals  Environmental Resources Management, Inc. (ERM Group) , the co...
  • James Hansen interview (video) of why he retired from NASA to be more active in climate actions
    by Climate Science Watch, April 12, 2013 Sustainability Media Lab shot this video interview on April 10, 2013, with James Hansen on why he l...
  • Justin Gillis, NYT: Maverick climate scientist James Hansen retiring from NASA, can now take a more active role in lawsuits challenging states and the federal government over their failure to limit CO2 emissions
    Climate Maverick to Quit NASA by  JUSTIN GILLIS , The New York Times , April 1, 2012 James E. Hansen , the climate scientist who issued the ...
  • Exxon acting like national guard under martial law in Mayflower, Arkansas, Pegasus tar sands dilbit spill cleanup
    Arkansas town in lockdown after oil spill nightmare by  Suzi Parker , Grist, April 5, 2013 REUTERS / Jacob Slaton There’s one Exxon gas stat...
  • Steve Horn: State Department's out-sourced Keystone XL environmental impact evaluation performed without knowing pipeline's route!!!
    by Steve Horn, DeSmogBlog, July 8, 2013 The State Department's decision to hand over control to the oil industry to evaluate its own ...
  • "A Reconstruction of Regional and Global Temperature for the Past 11,300 Years," by S. A. Marcott et al., Science, 339 (2013); doi: 10.1126/science.1228026
    Science  (8 March 2013),  Vol. 339, N o. 6124,  pp. 1198-1201  DOI:  10.1126/science.1228026 REPORT A Reconstruction of Regional and Global ...

Categories

  • 2012 temperatures (3)
  • 2013 temperatures (6)
  • acidizing (1)
  • Adam Siegel (1)
  • Adaptation (1)
  • Aerosols (7)
  • Africa (2)
  • Al Gore (1)
  • Alaska (6)
  • albedo (2)
  • albedo flip (5)
  • ALEC (8)
  • Alun Hubbard (2)
  • Amazon rainforest (1)
  • Andrew C. Revkin (2)
  • Andrew Freedman (1)
  • Andrew Glikson (1)
  • Andrew J. Weaver (1)
  • Antarctic bottom water (2)
  • Antarctic Circumpolar Winds (1)
  • Antarctic Ice Sheet -- Western (WAIS) (4)
  • Antarctic Oscillation - AAO (1)
  • Antarctic warming (1)
  • Anthony R Ingraffea (1)
  • Anthony Watts (1)
  • Arctic amplification (7)
  • Arctic melt season (1)
  • Arctic Methane Emergency Group (7)
  • Arctic Ocean (5)
  • Arctic Oscillation (5)
  • Arctic sea ice mean speed (4)
  • Arctic sea ice volume (24)
  • Argo (1)
  • Atlantic Meridional Overturning Circulation - AMOC (2)
  • Atmospheric CO2 (8)
  • Australia (6)
  • Barry Bickmore (1)
  • bees (9)
  • Benjamin Santer (4)
  • Bidder 70 (1)
  • Big Oil Big Coal (89)
  • Bill McKibben (11)
  • Black carbon (2)
  • BOEMRE (2)
  • Brad Johnson (1)
  • Brazil (2)
  • Brian Eister (2)
  • Canada (24)
  • Carbon sinks (2)
  • Catastrophic climate change (1)
  • Charles Monnett (3)
  • China (15)
  • Chris Mooney (1)
  • Civil resistance (33)
  • Climate Change Criminals (24)
  • Climate Denial Machine (47)
  • Climate modelling (5)
  • Climate Patriots (2)
  • Climate sensitivity (1)
  • CO2 draw-down (1)
  • Consequences to infrastructure (1)
  • contrails (1)
  • coral reefs (1)
  • Corexit (1)
  • corrupt officials (60)
  • Coupled ice-ocean model (3)
  • Coupled ocean–atmosphere model (2)
  • crop yields (9)
  • CRU e-mails (2)
  • CryoSat-2 (1)
  • cyclones (2)
  • Dana Nuccitelli (9)
  • Dansgaard–Oeschger event (1)
  • David Roberts (2)
  • David Spratt (2)
  • Deforestation (2)
  • deglaciation (1)
  • Denial psychology (9)
  • divestment (11)
  • Donors Trust (2)
  • Drought (9)
  • dust (1)
  • earthquakes (3)
  • East Siberian Arctic Shelf (1)
  • Eastern Siberian Arctic Shelf -- ESAS (2)
  • Eemian (3)
  • Eli Rabett (5)
  • Elizabeth Kolbert (1)
  • Ellesmere (1)
  • ENSO (11)
  • Eric Rignot (1)
  • Extreme weather events (15)
  • Ferrel cells (1)
  • First Nations (9)
  • Flooding (7)
  • floods (1)
  • Forest fires (3)
  • fracking (47)
  • Fred Singer (1)
  • freshwater lens (1)
  • fugitive emissions (2)
  • Gareth Renowden (2)
  • Gavin Schmidt (3)
  • Geoengineering (1)
  • George Monbiot (2)
  • Gerald Meehl (2)
  • glacial runoff (1)
  • Global dimming (1)
  • glyphosate (1)
  • Graham Readfearn (9)
  • Greenland ice melt (21)
  • Greenpeace (3)
  • Greg Laden (3)
  • GrIS (9)
  • Hadley cells (2)
  • Hadley circulation (2)
  • Hans Joachim Schellnhuber (1)
  • Harrison Loony Tool Schmitt (1)
  • Heartland Institute (14)
  • heat dome (3)
  • Heat waves (13)
  • hockey stick (10)
  • Holocene thermal maximum (2)
  • hurricanes (1)
  • IceSat (2)
  • Igor Semiletov (4)
  • Inhofe (2)
  • Insurers (2)
  • Intertropical Convergence Zone - ICZ (2)
  • Jakobshavn Isbræ (1)
  • James Hansen (15)
  • Jason Box (10)
  • Jeff Masters (6)
  • Jennifer Francis (7)
  • Jeremy Grantham (1)
  • Jet stream (4)
  • John Abraham (15)
  • John Christy (1)
  • John Cook (2)
  • John Kerry (2)
  • Joseph Romm (12)
  • Josh Willis (2)
  • Judith Curry (1)
  • Julie Brigham-Grette (1)
  • Justin Gillis (3)
  • Katharine Hayhoe (2)
  • Kerry Emanuel (2)
  • Kevin Grandia (1)
  • Kevin Trenberth (14)
  • Keystone Principle (14)
  • Keystone XL (57)
  • Koch Industries (13)
  • Konrad Steffen (2)
  • Lake El'gygytgyn (1)
  • Leo Hickman (2)
  • Marc Morano (3)
  • Mark Boslough (1)
  • Mark Hertsgaard (1)
  • Mark Serreze (1)
  • Mass extinctions (1)
  • Mauri Pelto (1)
  • Medieval Climate Anomaly (2)
  • Meridonal heat transport - MHT (1)
  • Methane (2)
  • Methane Gun hypothesis (9)
  • Methane hydrates (11)
  • Michael Mann (20)
  • Michael Oppenheimer (2)
  • Michael Tobis (2)
  • Milne Ice Shelf (1)
  • Mitigation (1)
  • Monckton (6)
  • Monsanto (3)
  • Myles Allen (1)
  • Naomi Klein (1)
  • Natalia Shakhova (4)
  • national security (3)
  • Neela Banerjee (1)
  • neonicotinoid pesticide (9)
  • Nitrous oxide (1)
  • North Atlantic meridional overturning circulation (1)
  • North Atlantic Oscillation (2)
  • Obama (1)
  • OccupyWallStreet (5)
  • ocean acidification (2)
  • Ocean chemistry (1)
  • ocean heat content (15)
  • Ocean salinity (2)
  • Ocean temperatures (4)
  • ozone levels (1)
  • paleo-climate (4)
  • Paleo-CO2 (2)
  • Patrick Michaels (1)
  • Paul Douglas (1)
  • PDO - Pacific Decadal Oscillation (4)
  • Peak food (10)
  • Peak oil (1)
  • Peak Water (3)
  • Permafrost (1)
  • Permafrost - subsea (2)
  • Permian mass extinction (1)
  • Peter Gleick (3)
  • Peter Sinclair (13)
  • Peter Wadhams (4)
  • Petermann Glacier (1)
  • Phil Jones (1)
  • Pinatubo rebound effect (2)
  • pine beetles (1)
  • Pine Island Glacier (1)
  • PIOMAS (3)
  • polar bears (5)
  • Polar jet stream (8)
  • Polar vortex (2)
  • Positive feedbacks (1)
  • Precipitation extremes (4)
  • radiative forcing (2)
  • Ray Weymann (1)
  • Raypierre (1)
  • resilience (1)
  • resource scarcity (3)
  • Richard Alley (3)
  • Richard Somerville (1)
  • Rick Piltz (2)
  • Robert Corell (1)
  • Roger Pielke Jr. (1)
  • Rossby waves (2)
  • Russia (1)
  • saltwater intrusion (1)
  • Scott Mandia (1)
  • Sea level rise (13)
  • sea surface temperature anomalies (1)
  • Sediment cores (2)
  • Shell Oil (4)
  • snow cover (3)
  • Snowden (1)
  • Solar activity (1)
  • solar radiation (1)
  • Soot (3)
  • Stefan Rahmstorf (5)
  • Steve Horn (13)
  • Storm intensity (1)
  • Storm tracks diverted polewards (1)
  • Stratospheric Sudden Warmings (3)
  • sulfoxaflor (1)
  • Tamino (1)
  • tar sands (57)
  • Ted Scambos (1)
  • Terracide (1)
  • These people are completely insane (7)
  • Thomas L. Friedman (2)
  • threat multiplier (1)
  • Threat to our democracy (49)
  • Tim DeChristopher (1)
  • Tipping elements (1)
  • Tom Steyer (1)
  • Tornado statistics (2)
  • TransCanada (3)
  • trees (1)
  • tropospheric water vapor (1)
  • Typhoon Yasi (1)
  • Van Jones (2)
  • volcanism (1)
  • WAIS (1)
  • Waleed Abdalati (1)
  • Walker circulation (2)
  • Walt Meier (1)
  • Water shortage (2)
  • William Krabill (1)
  • Willie Soon (1)
  • Wind pattern changes (2)
  • Wind power (2)

Blog Archive

  • ▼  2013 (500)
    • ▼  September (27)
      • James Hansen: Tar Sands and Dirty Tricks
      • Summer 2013 weather extremes tied to extraordinari...
      • Court rulings show judges accept climate science
      • DC judge denies another effort to derail Michael M...
      • Scientist Michael Mann named in top 10 influential...
      • Justin Gillis, NYT: A Climate Alarm, Too Muted for...
      • Top Obama aide Heather Zichal worked the Pavillion...
      • Call Sacramento. Vote NO on SB4
      • Graham Readfearn: The undiscerning climate bookshelf
      • Graham Readfearn: Australia's Department of Defenc...
      • Top Occupy Wall Street Cartoons
      • URGENT: phone your CA rep to prevent industry amen...
      • Tom Steyer, NexGen: Keystone XL bad economics for ...
      • Daily Mail Lies! No 60% recovery in Arctic sea ice...
      • Steve Horn: The Flip Side of Obama’s Keystone XL D...
      • Joseph E. Stiglizt, NYT: Why Janet Yellen, Not Lar...
      • "Global crop exposure to critical high temperature...
      • Naomi Klein: Green groups may be more damaging th...
      • Margaret Heffernan: Dare to Disagree
      • "Spring snow cover extent reductions in the 2008-2...
      • U.S. Becomes Largest Wood Pellet Exporter,Enviva, ...
      • Rebuttal to Michael Tobis' unsubstantiated attacks...
      • Why trust climate models? It’s a matter of simple ...
      • Steve Horn: "Frackademia" By Law: Section 999 of t...
      • MUST SEE, Peter Sinclair: No Slowdown in Global Wa...
      • Dana Nuccitelli: The Pacific Ocean fills in anothe...
      • Posts from August 2013
    • ►  August (78)
    • ►  July (74)
    • ►  June (56)
    • ►  May (62)
    • ►  April (105)
    • ►  March (98)
Powered by Blogger.

About Me

Unknown
View my complete profile