TheNextGeneration

  • Subscribe to our RSS feed.
  • Twitter
  • StumbleUpon
  • Reddit
  • Facebook
  • Digg
Showing posts with label Heat waves. Show all posts

Thursday, August 29, 2013

Crops will face more extreme heat during flowering season

Posted on 7:04 PM by Unknown

Insight: crops will face more extreme heat during flowering season

by Sharon Gourdji, environmentalresearchweb, August 26, 2013

Extreme heat during the flowering period of crops can interfere with pollination and grain formation, and severely reduce yields. Along with increases in global mean temperature, extreme heat events – where temperatures cross crop-specific critical thresholds – are becoming increasingly common. In this study, we found that wheat around the world has been exposed to extreme heat in the last 30 years and project that wheat, maize and rice will be exposed to three times as much heat by the 2050s.
Reaching critical temperatures
We started with global maps of harvested areas for four major crops: maize, rice, soybean and wheat. We then paired these regions with crop calendars and air temperatures between sowing and harvest for each year from 1980 to 2059. As well as calculating growing season mean temperatures, we identified a 30-day window around flowering in the middle of the season, and then counted the number of days in this period when temperatures crossed critical values, and where we would expect to see large yield declines. These temperatures are 34˚C for wheat, 35˚C for maize, 36˚C for rice, and 39˚C for soybean. 

We then constructed historical air temperatures from 1980 to 2011 by interpolating weather station data. Future temperature projections up to the 2050s were taken from a range of climate models included in the CMIP5 inter-comparison project. 

Our results show that maize has the highest current exposure to heat, with 15% of the total global area being exposed to temperatures above the critical temperature in the 2000s. Wheat in the Middle East and Central and South Asia has become increasingly problematic in recent decades, while the main rice-growing regions in South, East and Southeast Asia are expected to cross temperature thresholds increasingly in the next 30 to 40 years.

While faster plant growth at higher temperatures may lead to earlier flowering and somewhat reduced extreme heat exposure for wheat grown in temperate areas, this will have little impact for crops grown in tropical locations, where the temperature varies little throughout the year. Other environmental change factors, such as rising atmospheric carbon dioxide and changes in soil moisture, will also affect crop yields in coming decades. That said, stress during the reproductive period will continue to present a risk for crop production regardless of other beneficial changes. Farmers, working with all levels of government, need to think proactively about how to prepare for these changes through crop and variety switching, shifting sowing dates, irrigation and agronomic management, and potentially moving cropping systems to other regions altogether.

Related link

  • Global crop exposure to critical high temperatures in the reproductive period: Historical trends and future projections, Sharon M Gourdji et al. (2013), Environ. Res. Lett., 8 024041

About the author

Sharon Gourdji is a post-doctoral fellow at Stanford University in the Department of Environmental Earth System Science and the Center on Food Security & the Environment. Her work focuses on climate-change impacts on agriculture and the evaluation of adaptation options around the globe.
Read More
Posted in crop yields, Heat waves, Peak food, resource scarcity | No comments

Sunday, August 18, 2013

Robert Scribbler: China Falls Under Suspicion of Covering Up Deaths as Ocean Heat Dome Expands to Blanket Korea and Japan

Posted on 8:38 AM by Unknown

by Robert Scribbler, August 13, 2013

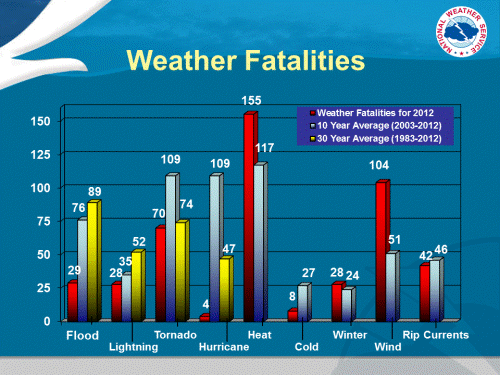
US Weather Fatalities by Type
(Image source: NOAA)
According to recent reports from NOAA and the CDC, heat is the most lethal form of weather in the United States. Death and injury rates have been on the rise as human-forced temperature increases have expanded, surging northward into major metro areas such as New York City. The CDC report showed a growing number of heat deaths and injuries for this northern region, with the New York Metro area seeing an average of 13 deaths and over 440 heat injuries each year during the period from 2000 to 2011. Nationwide, the average number of heat fatalities surged to 117 during a period from 2003 to 2011.
Heatwaves have hit the NYC region time and time again over the past decade, driving the death and injury rate inexorably higher. However, the heat impacting that area is paltry when compared to the extreme and deadly temperatures that have broiled southeastern China since late July. For more than three weeks, the Shanghai region of China has experienced almost daily temperatures in excess of 100 degrees Fahrenheit and sweltered under very high humidity for such hot conditions. This combination has pushed wet bulb temperatures (a measure that simulates the temperature of human skin) into a range of 29 to 32 degrees Celsius, very close to the lethal human limit of 35 degrees C.
On Sunday, an extreme heat pulse sent thermometers soaring to 109 degrees Fahrenheit in the city of Shengxian — its hottest temperature ever recorded and a scorching 32.3 degree wet bulb temperature. Meanwhile, on the same day, Hangzhou had hit a new all time record high temperature of 105.8 degrees Fahrenheit, the twelfth time since July 24th that Hangzhou has tied or broken its old all time temperature record which, in some cases, was set just the day before.
High heat and humidity of this kind is deadly to humans because as temperatures approach 35 degree C wet bulb readings, it is nearly impossible for the human body to carry away the excess heat it generates through evaporation. Never has a wet bulb temperature of 35 degrees C been recorded by humans. However, climate scientists such as James Hansen have asserted that it’s just a matter of time under the current regime of human-caused warming before we hit that ominous mark.
So have thousands died?
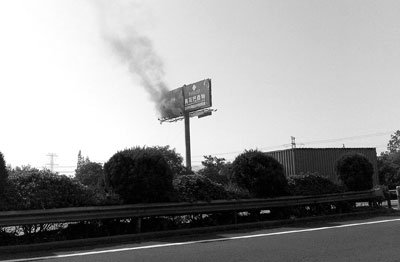
Road Sing Burns in Shanghia Region
Road Sign Burns Under Record Heat in Shanghai Region
(Image source: Shenzhen Daily)
As reports of vehicle fires and sporadically smoldering infrastructure in the massive Chinese heatwave flared, suspicions emerged that Chinese officials are covering up what are potentially thousands of heat-related deaths.
According to Chinese news agencies, the official report is that about two dozen have died so far in Shanghai’s record-shattering heatwave. But similar heat in Europe and Russia resulted in tens of thousands of deaths over the past decade. At issue is the fact that China’s current record heat and humidity are at levels never before experienced in its weather history and that this event is even more intense than the deadly heatwaves of Europe and Russia. Add to this extraordinarily dangerous event the fact that more than 400 million people live in the region of China currently being socked by record heat and the vague reports coming out of China seem highly incongruent.
Never before has such high wet bulb temperatures hit a region of so dense a population. Yet China has only continued to report the vague ‘dozens’ estimate.  It was this discrepancy thatcaused WeatherUnderground Historian Christopher Burt to speculate that China may be covering up a catastrophic rash of fatalities:
Eastern China, where about 30% of the population of the country and 5% of the global population reside (approximately 400 million people) has undergone a heat wave unprecedented in its history. No one really knows how many have died as a result of the heat wave (Chinese news sources claim ‘about two dozen’), but statistically it is almost certain that many thousands must have perished as the result of the heat over the past month.
If Christopher Burt’s, quite rational, analysis ends up proving true, we can expect reports of fatalities to begin to slowly trickle out of China. Misreporting and under-reporting of Chinese heatwave casualties would also be yet one more instance of government officials and mainstream media downplaying and under-reporting the effects of catastrophic events related to human-caused climate change. Such under-reporting is yet one more manifestation of a dangerous and paralyzing denial that has so hampered an effective response to these increasingly dangerous and self-inflicted events.
Making such a call, however, is possibly premature as residents of this region are more acclimated to excessive heat than Europeans or Russians. As Burt notes:
One thing to keep in mind, however, is that it is ALWAYS hot and humid in eastern China during the summer (unlike Russia and Western Europe), so perhaps the population has learned to adapt to extreme heat.
The Ocean Heat Dome Expands to Cover Korea and Japan
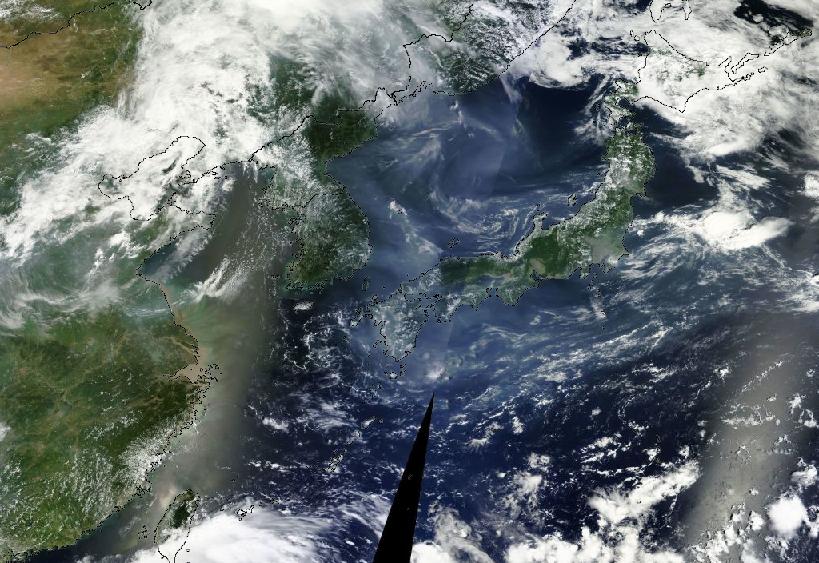
Ocean Heat Dome
Ocean Heat Dome Over China, Korea and Japan
(Image source: NASA/Lance-Modis)
A sprawling heat dome high pressure system that has scorched a region stretching from coastal China to a large expanse of the Pacific Ocean shifted eastward into Korea and Japan over the weekend. Southern Japan saw temperatures surge into the 100s with Shimanto recording the highest temperature ever measured in Japan of 105.8 degrees Fahrenheit (41 degrees Celsius). Tokyo, meanwhile, broke the record for its hottest minimum temperature at 86.7 degrees Fahrenheit (30.4 C).
South Korea, over the same period, reported 8 deaths as temperatures soared to 102.2 degrees Fahrenheit (39 C) in Busan. Temperatures in Seoul hit the still hot, but more moderate, 90s (32 C +).
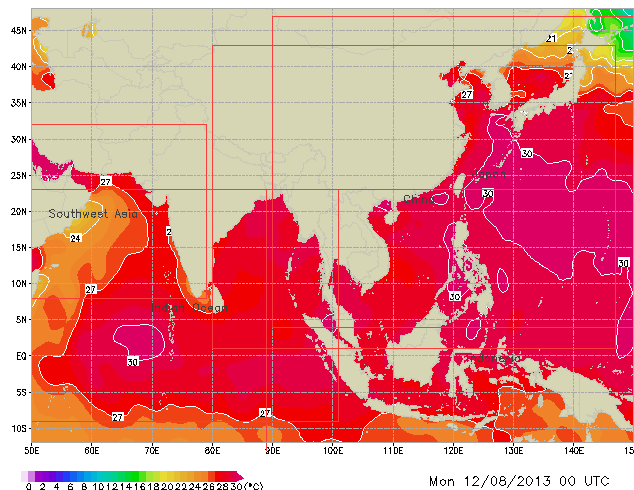
Both South Korea and Japan are surrounded on multiple sides by water. This geographic feature would usually provide a cooling effect as ocean temperatures are typically many degrees cooler than land temperatures. But, in this case, a massive heat dome is baking the ocean itself to unprecedented high surface water temperatures. As a result, a large area of open ocean now shows readings above 30 degrees Celsius ( 86 Fahrenheit). This extremely hot, near 90 degree water, has formed the central pulse of the current heatwave even as it has pumped extraordinarily humid air for such hot conditions over adjacent land areas. A shift to the north of this large and still growing region of extraordinarily hot ocean water led to the record steamy conditions over Japan and Korea during the past few days — both of which can expect little relief from the now, very hot, water.
Asia in Hot Water
Ocean Heat Dome Puts Asia in Hot Water
(Image source: Weather Online)
Forecasts for Shanghai, Korea, and Japan call for slightly less sweltering temperatures in the upper 90s with more isolated readings in the 100s as clouds are expected to move in and increase chances of rainfall by later this week. A slight improvement but a welcome change, nonetheless. Meanwhile, hot ocean conditions create a risk for continued very hot temperatures for much of this coastal region.
(Hat Tip to Colorado Bob for the head’s up)
http://robertscribbler.wordpress.com/2013/08/13/china-falls-under-suspicion-of-covering-up-deaths-as-ocean-heat-dome-expands-to-cover-korean-and-japan/
Read More
Posted in 2013 temperatures, China, heat dome, Heat waves | No comments

Wednesday, August 14, 2013

China and Japan suffer unprecedented heat waves

Posted on 10:32 AM by Unknown
Hat tip to rjsigmund

China heat wave: Beware of 'spontaneously' combusting trees and billboards - Yahoo! News: For the past few weeks Beijing has been either a furnace or a sauna, depending on the rain, as China endures its hottest summer in more than half a century. The press is full of the most alarming stories as the country sweats through its second major heat wave this year. In the southern city of Wuhan, witnesses last weekend reported seeing a willow tree spontaneously burst into flames, “which rarely happens under normal circumstances,” according to a local forestry expert. In the eastern province of Zhejiang the same thing happened to a billboard, which presumably is equally unusual. I myself have sometimes felt I was about to go up in flames recently, and I am not alone. The Chinese National Meteorological Center announced on Monday that temperatures had exceeded 95 degrees Fahrenheit in eight provinces on more than 25 of the previous 41 days. It hasn’t been that hot here since 1961. For the first time ever the government has declared the heat to be a level two weather emergency – a warning normally reserved for typhoons and floods – amid reports that more than 40 people have died from the high temperatures.  

Weather Extremes : Japan Breaks National Heat Record. Chinese Heat Wave Continues | Weather Underground: An all-time national heat record was set in Japan today (August 12th) when the temperature peaked at 41.0°C (105.8°F) at the Ekawasaki site in Shimanto (part of Kochi Prefecture). The previous record of 40.9°C (105.6°F) was recorded at Tajima and Kumagaya on August 16, 2007. Tokyo endured its warmest daily minimum on August 11th with a low of 30.4°C (86.7°F). This was the 2nd warmest minimum on record for Japan following a minimum of 30.8°C (87.4°F) at Itoigawa on August 22, 1990. On Sunday, August 11th, the temperature peaked at 42.7°C (108.9°F) at Shengxian, its hottest temperature measured so far during the heat wave. At Hangzhou the temperature reached 41.1°C (106.0°F) on August 11th and 40.3°C (104.5°F) on August 12th marking the 12th day since July 24th that the city surpassed or tied its previous all-time record high of 40.3° set on August 1, 2003. Eastern China, where about 30% of the population of the country and 5% of the global population reside (approximately 400 million people) has undergone a heat wave unprecedented in its history. No one really knows how many have died as a result of the heat wave (Chinese news sources claim ‘about two dozen’), but statistically it is almost certain that many thousands must have perished as the result of the heat over the past month.  
Read More
Posted in 2013 temperatures, China, Heat waves | No comments

Thursday, August 1, 2013

China swelters in record heat wave

Posted on 8:39 PM by Unknown

By Staff  The Associated Press, August 1, 2013

  •  52
  •  
  •  4
  •  
  •  Plus 1
  •  
  • Share
 PLAY VIDEO
Above: Zoo animals in eastern China try to stay cool as the country deals with its most extreme heatwave in 140 years
SHANGHAI, China – It’s been so hot in China that folks are grilling shrimp on manhole covers, eggs are hatching without incubators and a highway billboard has mysteriously caught fire by itself.
“It is just hot! Like in a food steamer!” 17-year-old student Xu Sichen said outside the doors of a shopping mall in the southern financial hub of Shanghai while her friend He Jiali, also 17, complained that her mobile phone had in recent days turned into a “grenade.”The heat wave – the worst in at least 140 years in some parts – has left dozens of people dead and pushed thermometers above 40 degrees C (104 F) in at least 40 cities and counties, mostly in the south and east. Authorities for the first time have declared the heat a “level 2″ weather emergency- a label normally invoked for typhoons and flooding.
“I’m so worried that the phone will explode while I’m using it,” He said.
Extreme heat began hitting Shanghai and several eastern and southern provinces in early July and is expected to grip much of China through mid-August.
Shanghai set its record high temperature of 40.6 C (105 F) on July 26, and Thursday’s heat marked the city’s 28th day above 35 C. At least 10 people died of heat stroke in the city over the past month, including a 64-year-old Taiwanese sailor, the official Xinhua News Agency said.
Wu Guiyun, 50, who has a part-time job making food deliveries in Shanghai, said she has been trying to linger inside air-conditioned offices for as long as possible whenever she brings in a takeout order. Outside, she said: “It’s so hot that I can hardly breathe.”
The highest temperature overall was recorded in the eastern city of Fenghua, which recorded its historic high of 42.7 degrees (108.9 F) on July 24.
On Tuesday, the director of the China Meteorological Administration activated a “level 2″ emergency response to the persistent heat wave. This level requires around-the-clock staffing, the establishment of an emergency command centre and frequent briefings.
Some Chinese in heat-stricken cities have been cooking shrimps, eggs and bacon in skillets placed directly on manhole covers or on road pavement that has in some cases heated up to 60 degrees C (140 F).
In one photo displayed prominently in the China Daily newspaper, a boy tended to shrimps and an egg in a pan over a manhole cover in eastern Chinese city of Jinan.
In the port city of Ningbo in Zhejiang province, glass has cracked in the heat, vehicles have self-combusted, and a highway billboard caught fire by itself, sending up black smoke in the air, according to China Central Television. The broadcaster said the heat might have shorted an electrical circuit on the billboard.
In the southern province of Hunan, a housewife grabbed several eggs stored at room temperature only to find half-hatched chicks, state media reported.
A joke making the rounds: The only difference between me and barbequed meat is a little bit of cumin.
—
Associated Press writer Didi Tang in Beijing and news assistant Fu Ting in Shanghai contributed to this report.
http://globalnews.ca/news/754643/china-swelters-in-record-heat-wave/
Read More
Posted in 2013 temperatures, China, Heat waves | No comments

Friday, July 19, 2013

Andrew Freedman: Drunken [backwards, east to west] weather pattern leads to deadly heat

Posted on 1:42 PM by Unknown

‘Drunken’ Weather Pattern Leads to Deadly Heat

 987  399  345 S
Andrew Freedmanby Andrew Freedman, Climate Central, July 18, 2013
The heat wave that has built across the eastern U.S. — roasting cities from Memphis to Washington to Boston in a stifling blanket of heat and humidity — has had one strange characteristic that meteorologists cannot yet explain in a long-term climate context. Rather than moving west to east, as typical weather patterns do in the Northern Hemisphere, weather systems across the country have moved in the opposite direction, like a drunken driver on a dark stretch of highway, drifting from east to west during the past two weeks.
And like drunk driving, the weather pattern is having serious —  even deadly — consequences, with at least one death being blamed on the heat, according to the Associated Press. 
The "Bermuda high" that often pumps warm and humid air into the East Coast during July and August decamped around July 11 from Bermuda and came ashore, eventually migrating all the way to the Midwest by July 15. The summertime high pressure ridge, sometimes referred to as a “heat dome,” has set air pressure records as recorded by weather balloons in Pittsburgh and Virginia, and has been responsible for sending air temperatures rocketing into the mid- to upper-90s, and even the lower triple digits, in some parts of the East.

Animation of 500 mb pressure anomalies from July 12 to July 18, 2013, showing the migration of the heat dome from east to west (in orange and red) and the upper level low toward Texas (blue). Credit: Ryan Maue for Weatherbell.com.

New York’s John F. Kennedy Airport, for example, broke a daily high temperature record on Thursday, with a high of 100°F. The heat index, which is a measure how the temperature feels to the humid body, has reached the dangerous range of 105 to 115°F in some spots. Heat is the No. 1 weather-related cause of death in the U.S. in an average year.
Making the heat even more dangerous is that many areas affected have not been getting overnight relief. In New York’s Central Park, the overnight low on Wednesday night into Thursday morning was 79 °F, tying a record for the highest such temperature for the date. Record-high low temperatures were also set in the Midwest and Mid-Atlantic. Washington, D.C., may challenge a record for the longest number of consecutive hours with air temperatures above 80 °F. 
The National Weather Service issued heat warnings and advisories for nearly two-dozen states on Thursday, with a smaller number to be affected on Friday in the densely populated Mid-Atlantic and Northeast.
While heat waves during July are nothing new, the weather pattern that is creating this one is rare enough for meteorologists to take note. In addition to the Bermuda leaving its more tropical locale and camping out in Michigan, an area of low pressure at the upper levels of the atmosphere has also been roaming the U.S. since July 11, drifting from east to west, traveling from the Mid-Atlantic states to Texas, where it brought some welcome rainfall.
With the jet stream (in blue and green) located far to the north, over Canada, weather systems have drifted from east to west across the U.S. Credit: Weatherbell.com.
The air flow heading in the opposite direction across the U.S. is abnormal, as is the strength of the dome of high pressure. In recent years there have been numerous instances of strong and long-duration high pressure areas that have led to extreme weather events, including the Russian heat wave of 2010. According to NOAA, scientists are scheduled to meet at Oak Ridge National Laboratory in September to explore whether such “monster ridges” of high pressure are becoming more frequent or more intense as the atmosphere warms in response to manmade greenhouse gas emissions.
Jon Gottschalck acting chief of the Operational Prediction Branch at NOAA’s Climate Prediction Center, told Climate Central in an email that it’s not yet clear exactly how unusual the recent weather pattern has been, or what has been driving it. “Yes, the evolution you describe of the upper-level low and high pressure ridge moving east to west is definitely unusual. But it is not easy to quantify really how unusual,” he said.
“It would take considerable time to crunch through the data and utilize a methodology to accurately pick events like this that have occurred in the historical record and quantify [them]. From a climate-forcing perspective, there is no clear climate pattern right now that we can point to as a contributing factor and so we can really only attribute this evolution to natural internal variability, at least at this stage.” [no, you cannot attribute it to anything since no study was done!]
Related Content
Heat Wave May Threaten World's Hottest Temperature Record
Historic March Heat Wave Tallies More Records
2010 Russian Heat Wave More Extreme Than Previously Thought
Climate Change Increased Likelihood of Russian 2010 Heat Wave
Follow the author on Twitter @afreedma or @ClimateCentral. 
http://www.climatecentral.org/news/drunken-weather-pattern-leads-to-deadly-heat-16260
Read More
Posted in Andrew Freedman, Extreme weather events, Heat waves | No comments

Wednesday, July 10, 2013

R.L. Miller: Climate Disconnect -- Republicans let their districts fry

Posted on 6:19 PM by Unknown

Climate disconnect: Republicans let their districts fry

byRLMillerFollowforClimate Hawks, Daily Kos, July 9, 2013,
To the surprise of absolutely no one following climate change politics, Republicans are voting against their districts' health and safety. A new report from House Energy and Commerce Democrats reveals a climate disconnect. The report finds that Republican members representing the districts most affected by record high temperatures cast anti-climate votes 96% of the time in the 112th Congress. No similar "climate disconnect" was found in the voting records of House Democrats; Democratic members representing districts most affected by high temperatures voted 86% of the time to uphold the Administration’s authority to address climate change or to act to address climate change.
The greatest number of record-setting daily high temperatures in 2012 were experienced in ten Congressional districts all represented by Republicans: Nebraska 3rd, represented by Adrian Smith; South Dakota At Large, represented by Kristi Noem; Wyoming At Large, represented by Cynthia Lummis; Kansas 1st, represented by Tim Huelskamp; Missouri 6th, represented by Sam Graves; Iowa 4th, represented by Steve King; Colorado 3rd, represented by Scott Tipton; Texas 13th, represented by Mac Thornberry; Texas 19th, represented by Randy Neugebarger; and Arkansas 1st, represented by Rick Crawford. 97% of their votes on climate were opposed to action and in favor of frying their districts.
For comparison's sake, the ten Democratic-represented congressional districts with the highest number of record temperatures were Iowa’s 1st and 2d, Minnesota’s 7th, New Mexico’s 3d, Wisconsin’s 3d, Minnesota’s 1st, West Virginia’s 3d, Maine’s 2d, Mississippi’s 2d, and Colorado’s 2d. Democratic members representing the districts with the most record high temperatures voted 79% of the time to uphold Administration authority to address climate change or to otherwise act to address climate change. Only two of the Democratic members representing these districts – Reps. Collin Peterson (MN-7) and Nick Rahall (WV-3) – voted for the anti-climate position more than half the time.
If the Republicans truly cared about the people of their districts, they would connect the dots between their actions and the health and safety of the people they represent. They don't. They're too beholden to the fossil fuel industry and too disconnected from the people they nominally represent. It's time to vote them out of office. Climate Hawks Vote, a new project with the slogan: "Climate matters. We vote," aims to do just that.
http://www.dailykos.com/story/2013/07/09/1222293/-Climate-disconnect-Republicans-let-their-districts-fry
Read More
Posted in Big Oil Big Coal, Climate Change Criminals, Climate Denial Machine, corrupt officials, Heat waves, Threat to our democracy | No comments

Sunday, June 30, 2013

Scientists Predicted A Decade Ago Arctic Ice Loss Would Worsen Western Droughts. Is That Happening Already?

Posted on 10:40 AM by Unknown

by Joe Romm, Think Progress, June 30, 2013

Scientists predicted a decade ago that Arctic ice loss would bring on worse western droughts. Arctic ice loss has been much faster than the researchers — and indeed all climate modelers — expected (see “CryoSat-2 Confirms Sea Ice Volume Has Collapsed“).
It just so happens that the western U.S. is in the grip of a brutal, record-breaking drought. Is this just an amazing coincidence — or were the scientists right and what would that mean for the future? I ask the authors.
Here is the latest drought monitor:
And that drought monitor predates the record-smashing heat wave now gripping the West.
Back in 2004, Lisa Sloan, professor of Earth sciences at UC Santa Cruz, and her graduate student Jacob Sewall published an article in Geophysical Research Letters, “Disappearing Arctic sea ice reduces available water in the American west” (subs. req’d).
As the news release at the time explained, they “used powerful computers running a global climate model developed by the National Center for Atmospheric Research (NCAR) to simulate the effects of reduced Arctic sea ice.” And “their most striking finding was a significant reduction in rain and snowfall in the American West”:
Where the sea ice is reduced, heat transfer from the ocean warms the atmosphere, resulting in a rising column of relatively warm air. The shift in storm tracks over North America was linked to the formation of these columns of warmer air over areas of reduced sea ice in the Greenland Sea and a few other locations, Sewall said.
I contacted Sloan to ask her if she thought there was a connection between the staggering loss of Arctic sea ice and the brutal drought gripping the West, as her research predicted. She wrote (back in late March):
Yes, sadly, I think we were correct in our findings, and it will only be worse with Arctic sea ice diminishing quickly. California is currently in a drought (as I watch every day — our reservoirs are at about 50% capacity right now, and I fear for the coming fire season, owning a house that backs up to greenspace and forest).
She directed me to her ex-student, now Assistant Professor of Geology at Kutztown University of Pennsylvania because he had done some additional work.
Sewall wrote me:
I am attaching a more definitive study (multiple fully dynamic models with greenhouse gas forcing) on the topic from 2005. The end result is about the same as the original 2004 study, just nailed down better.
Comparing current changes (2011 summer ice and 2011/2012 winter precipitation season) to the 2004 paper:
(1) Ice concentrations in August 2011 weren’t too far off from the ‘future’ in the 2004 paper. The “future” in the 2004 paper was 2050, so it seems we are moving faster than predictions (which has been seen in multiple studies of Arctic sea ice). That is likely due to the relatively conservative greenhouse gas scenarios that were used for the earlier IPCC assessments and associated simulations. Potentially the forthcoming AR5 will have more accurate/realistic/extreme responses in Arctic ice.
(2) Observed precipitation seems to be lower than in the 2004 simulations (50 – 70% of ‘normal’ in the Sierras vs ~85 – 90% of normal in the simulations) based on snowfall data from 2011/2012.
(3) The pattern of wetter conditions to the north of California is as predicted in the 2004 paper, Washington State reporting 107 – 126% of ‘normal’ precipitation, Southern Alaska reporting 106 – 148% of ‘normal’ precipitation for 2011/2012.
I think the hypothesis from 2004 and 2005 is being borne out by current changes. The only real difference is that reality is moving faster then we though/hoped it would almost a decade ago.
The “more definitive” study is “Precipitation Shifts over Western North America as a Result of Declining Arctic Sea Ice Cover: The Coupled System Response” (available here).
That study found that “as future reductions in Arctic sea ice cover take place, there will be a substantial impact on water resources in western North America.”
I asked NCAR’s Kevin Trenberth to comment on these findings and he was concerned that using an artificially high CO2 level to get the models to explore what happens when Arctic sea ice collapses might conflate the CO2 effect with the ice loss. He also added “Variations from year to year are quite large and depend hugely on ENSO in the west of N America. You can not say whether they have come true at this point.”
I asked Sewall for a reply to those comments and he wrote:
Re. the point that Kevin Trenberth raises below and your e-mail just now:
I am quite confident that the changes are due to the decline in Arctic sea ice. The 2004 study did not alter CO2. The study was done with a prescribed decrease in Arctic sea ice cover (and a corresponding increase in local sea surface temperatures to reflect “non-freezing” conditions). The climate response presented in the 2004 study is, thus, a clean response due only to the imposed decline in Arctic sea ice cover.
In the 2005 study, I then moved to look at fully coupled models where the decline in Arctic sea ice cover was the result of warming temperatures, which were, in turn, the result of elevated CO2. This is presumably the same response we are now seeing.
Those coupled simulations showed the same response in storm tracks and western precipitation that we had found earlier in the 2004 study.
Kevin is correct that if I had only looked at the coupled simulations, it would be very difficult to determine if the changes in rainfall were due to the CO2 or to the Arctic ice reduction.
However, because the 2004 study was a clean sensitivity study, I can confidently attribute the exact same changes seen in the simulations I viewed in 2005 as being a direct result of the declining Arctic sea ice (and, thus, an indirect result of elevated CO2).
Kevin is also correct that variations from year to year are large and that the impact of Arctic ice on storm tracks varies significantly with ENSO state.
(1) In unpublished work that a student of mine did, we found that under strong El Nino conditions, Arctic ice concentration had less impact on storm tracks and precipitation in the west. Under more neutral (weak El Nino or weak La Nina) conditions, Arctic sea ice had a larger impact on storm tracks and precipitation in the west.
(2) Both the 2004 paper and the 2005 paper present results as 50-year averages. This, to some extent, takes care of the annual variability issue and suggests that sum total changes on climatic time scales will, indeed, result in dryer conditions in the west.
(3) While neither study employed ensembles, the 2005 study looks at 7 different models (all with slightly different parameterizations, resolutions, etc. so the effect is similar to that of a seven member ensemble) and the response, in spite of differences between the models, shows declining sea ice and declining precipitation in the American west with increases in precipitation from Oregon on northward.
If indeed this research is being confirmed, it suggests that on average — allowing for yearly variations due to ENSO — the West is going to become hotter and drier faster than people had expected.
Related Posts:
  • NOAA Bombshell: Warming-Driven Arctic Ice Loss Is Boosting Chance of Extreme U.S. Weather
  • My Nature Piece On Dust-Bowlification And the Grave Threat It Poses to Food Security
http://thinkprogress.org/climate/2013/06/30/2236751/scientists-predicted-a-decade-ago-arctic-ice-loss-would-worsen-western-droughts-is-that-happening-already/
Read More
Posted in Arctic sea ice volume, Climate modelling, crop yields, ENSO, Heat waves, Peak food, Water shortage | No comments

Wednesday, May 15, 2013

Jeff Masters: Extreme weather whiplash in the Upper Midwest -- Climate change much?

Posted on 11:24 AM by Unknown
by Jeff Masters and Christopher C. Burt, Wunderground Blog, May 15, 2013

Does not compute! That must be what residents of Iowa and the Midwest have have been saying to themselves on Tuesday as a ferocious heat wave unprecedented in intensity for so early in the year sent temperatures soaring as high as 108 °F. Just two weeks ago, the deepest snowfall ever measured during any May of record buried a wide swath from Arkansas to Minnesota, with Iowa breaking its all-time snowfall record for May (13” accumulation at Osage on May 1-3.) And how's this for a definition of "Weather Whiplash": Sioux City, Iowa, had their first-ever snowfall on record in the month of May on May 1st (1.4"), but hit an astonishing 106 °F yesterday. Not only was this their hottest temperature ever measured in the month of May, but only two June days in recorded history have been hotter (June, 10, 1933: 107 °F; and June 21, 1988: 108 °F). On May 12th they registered 29 °F, and thus had a 77-degree rise over 56 hours (from 6 a.m. May 12 to 1:30 p.m May 14.)


Figure 1. Intense heat and strong winds fanned a wildfire in northwestern Wisconsin's Douglas County near Gordon on Tuesday, May 14, 2013. The fire spread to 8,700 acres and forced dozens of residents to leave their homes. Image credit: Kevin Harter/Wisconsin Department of Natural Resources, and courtesy of wisconsinrapidstribune.com.

The hottest temperature of all on Tuesday was 108 °F at Tekamah, Nebraska. This is just 2 degrees short of warmest temperature ever recorded in the state of Nebraska during May: 110 °F at Broken Bow in 1895 (exact day unknown). Numerous all-time early season heat records were set on Tuesday, making the event the most notable May wave in the Midwest since multi-day event in 1934. That heat wave was not preceded by unusually cold weather, which is what makes the May 2013 Midwest heat event truly extraordinary. A few notable cases of "Weather Whiplash" from the May 14, 2013, heat wave:

- Chicago, Illinois, hit 91 °F, after hitting a low of 36 °F the previous morning. The 1-day temperature swing of 52 degrees was the city's greatest on record for the month of May.

- Rochester, Minnesota, where 14.5” of snow fell just 10-12 days ago (4th greatest snowstorm for any month on record), saw an all-time early season heat record of 97 °F on May 14th. The previous day, May 13th, it was 32 °F in Rochester -- a 65-degree rise in temperature over the course of 36 hours. 

- Omaha, Nebraska, hit 101 °F, the earliest 100 °F on record (old record was 102 °F on May 29, 1934). It was 32 °F in Omaha on May 12th! That tied for the coldest so late in the season with 32 °F on May 13, 1997, and also on May 15, 1983.

- Albert Lea and St. James, Minnesota, hit 102 °F (hottest in the state on Tuesday). Both cities had May snow less than two weeks previously. Tuesday morning, it was 27 °F at Crane Lake and Silver Bay, for a same-day state temperature spread of 75 degrees in Minnesota. This is a relatively common figure for California or Texas, but almost unprecedented for a Midwestern state.

- Minneapolis hit 98 °F, the hottest so early in season (next is 99 °F on May 22, 1925). May record is 106 °F on May 31, 1934 (the only time 100 °F has been measured during May).

- Norfolk, Nebraska, hit 103 °F, the hottest temperature ever measured so early in the year (previous record: 103 °F on May 25, 1967). A daily record low of 29 °F was recorded on May 12th, just two days previous.

Fires in Wisconsin and Minnesota
The intense heat was accompanied by strong winds, which fanned multiple fires in Minnesota and Wisconsin. One fire, near Gordon, Wisconsin, burned 8,700 acres, making it the largest fire in Wisconsin since the Cottonville fire on May 5, 2005, and the largest fire in Northern Wisconsin since the Oak Lake fire of April 22, 1980 (11,418 acres.) The Gordon fire destroyed 47 structures, including 17 homes, and forced the evacuation of several dozen people. The fire was 90% contained Wednesday morning. At least 25 smaller wildfires were reported in Minnesota, and Governor Mark Dayton signed an emergency order on Tuesday to help the Minnesota Interagency Fire Center fight wildfires around the state.

Why the crazy extremes? Blame the jet stream
The position of the jet stream is a critical controller of weather regimes across the U.S., Europe, and Asia. Precipitation-bearing low pressure system ride along the axis of the jet, and the jet marks the boundary between cold, Canadian air to the north, and warm, subtropical air to the south. On average, the jet flows from west to east, but the jet often departs from average. The jet is continually rippling with U-shaped troughs of low pressure that allow cold air to spill southwards. The troughs are counterbalanced by upside-down-U-shaped ridges of high pressure that bring warm air northwards. When these ridges and troughs grow to unusually large amplitude, record extremes of both cold and heat occur adjacent to each other. Often times, the jet will have multiple extreme loops that result in unusual extremes over large portions of the Northern Hemisphere. That was the case Tuesday in Europe, where an unusually strong ridge of high pressure was present over Western Russia, with a companion strong trough of low pressure over the UK.  Moscow hit 29.7 °C (85.5 °F) on Tuesday, and several locations within the city rose to 31 °C (88 °F). According to weather records researcher Maximiliano Herrera, this has never happened in the first half of May before. At the same time, up to 3" of snow fell in the UK on Tuesday, a rare occurrence for mid-May. Could climate change be a factor in the extreme gyrations of the jet stream this year? It could, and I discussed some of the possible connections in my April 2013 post: Unusually cold spring in Europe and the Southeast U.S. due to the Arctic Oscillation.


Figure 2. Monday afternoon's jet stream shows the pronounced ridge (upside-down U-shaped curve to the jet stream) over the midwestern U.S., which led to all-time, record-high temperatures for so early in the year. At the same time, a sharp trough of low pressure (U-shaped dip in the jet stream) was present over the East Coast, which allowed cold air from Canada to spill southwards and set record lows -- for example, 44 °F at Tallahassee, Florida on May 14, 2013.

http://www.wunderground.com/blog/JeffMasters/comment.html?entrynum=2407
Read More
Posted in 2013 temperatures, Extreme weather events, Forest fires, Heat waves, Jeff Masters, Jet stream | No comments
Older Posts Home
Subscribe to: Posts (Atom)

Popular Posts

  • James Hansen: Tar Sands and Dirty Tricks
    by James Hansen, September 13, 2013 The New Yorker just published (16 September issue) an excellent article "The President and the Pip...
  • Andrew Glikson: Another link between CO2 and mass extinctions of species
    by Andrew Glikson , The Conversation , March 22, 2013 It’s long been known that massive increases in emission of CO 2 from volcanoes, assoc...
  • Bombshell: Recent Warming Is ‘Amazing And Atypical’ And Poised To Destroy Stable Climate That Enabled Civilization
    by Joe Romm , Climate Progress , March 8, 2013 New Science Study Confirms ‘Hockey Stick’: The Rate Of Warming Since 1900 Is 50 Times Greater...
  • Real Pragmatism for Real Climate Change: Interview with Dr. John Abraham
    by John Stafford, OilPrice.com, March 26, 2013 At a time when extreme weather incidents are causing billions in damages, businesses, governm...
  • Steve Horn: State Dept Keystone XL Enironmental Reviewer Claimed Delaware Tar Sands Refinery Made Air Cleaner
    by Steve Horn, DeSmogBlog, July 18, 2013 A  DeSmogBlog  investigation reveals  Environmental Resources Management, Inc. (ERM Group) , the co...
  • James Hansen interview (video) of why he retired from NASA to be more active in climate actions
    by Climate Science Watch, April 12, 2013 Sustainability Media Lab shot this video interview on April 10, 2013, with James Hansen on why he l...
  • Justin Gillis, NYT: Maverick climate scientist James Hansen retiring from NASA, can now take a more active role in lawsuits challenging states and the federal government over their failure to limit CO2 emissions
    Climate Maverick to Quit NASA by  JUSTIN GILLIS , The New York Times , April 1, 2012 James E. Hansen , the climate scientist who issued the ...
  • Exxon acting like national guard under martial law in Mayflower, Arkansas, Pegasus tar sands dilbit spill cleanup
    Arkansas town in lockdown after oil spill nightmare by  Suzi Parker , Grist, April 5, 2013 REUTERS / Jacob Slaton There’s one Exxon gas stat...
  • Steve Horn: State Department's out-sourced Keystone XL environmental impact evaluation performed without knowing pipeline's route!!!
    by Steve Horn, DeSmogBlog, July 8, 2013 The State Department's decision to hand over control to the oil industry to evaluate its own ...
  • "A Reconstruction of Regional and Global Temperature for the Past 11,300 Years," by S. A. Marcott et al., Science, 339 (2013); doi: 10.1126/science.1228026
    Science  (8 March 2013),  Vol. 339, N o. 6124,  pp. 1198-1201  DOI:  10.1126/science.1228026 REPORT A Reconstruction of Regional and Global ...

Categories

  • 2012 temperatures (3)
  • 2013 temperatures (6)
  • acidizing (1)
  • Adam Siegel (1)
  • Adaptation (1)
  • Aerosols (7)
  • Africa (2)
  • Al Gore (1)
  • Alaska (6)
  • albedo (2)
  • albedo flip (5)
  • ALEC (8)
  • Alun Hubbard (2)
  • Amazon rainforest (1)
  • Andrew C. Revkin (2)
  • Andrew Freedman (1)
  • Andrew Glikson (1)
  • Andrew J. Weaver (1)
  • Antarctic bottom water (2)
  • Antarctic Circumpolar Winds (1)
  • Antarctic Ice Sheet -- Western (WAIS) (4)
  • Antarctic Oscillation - AAO (1)
  • Antarctic warming (1)
  • Anthony R Ingraffea (1)
  • Anthony Watts (1)
  • Arctic amplification (7)
  • Arctic melt season (1)
  • Arctic Methane Emergency Group (7)
  • Arctic Ocean (5)
  • Arctic Oscillation (5)
  • Arctic sea ice mean speed (4)
  • Arctic sea ice volume (24)
  • Argo (1)
  • Atlantic Meridional Overturning Circulation - AMOC (2)
  • Atmospheric CO2 (8)
  • Australia (6)
  • Barry Bickmore (1)
  • bees (9)
  • Benjamin Santer (4)
  • Bidder 70 (1)
  • Big Oil Big Coal (89)
  • Bill McKibben (11)
  • Black carbon (2)
  • BOEMRE (2)
  • Brad Johnson (1)
  • Brazil (2)
  • Brian Eister (2)
  • Canada (24)
  • Carbon sinks (2)
  • Catastrophic climate change (1)
  • Charles Monnett (3)
  • China (15)
  • Chris Mooney (1)
  • Civil resistance (33)
  • Climate Change Criminals (24)
  • Climate Denial Machine (47)
  • Climate modelling (5)
  • Climate Patriots (2)
  • Climate sensitivity (1)
  • CO2 draw-down (1)
  • Consequences to infrastructure (1)
  • contrails (1)
  • coral reefs (1)
  • Corexit (1)
  • corrupt officials (60)
  • Coupled ice-ocean model (3)
  • Coupled ocean–atmosphere model (2)
  • crop yields (9)
  • CRU e-mails (2)
  • CryoSat-2 (1)
  • cyclones (2)
  • Dana Nuccitelli (9)
  • Dansgaard–Oeschger event (1)
  • David Roberts (2)
  • David Spratt (2)
  • Deforestation (2)
  • deglaciation (1)
  • Denial psychology (9)
  • divestment (11)
  • Donors Trust (2)
  • Drought (9)
  • dust (1)
  • earthquakes (3)
  • East Siberian Arctic Shelf (1)
  • Eastern Siberian Arctic Shelf -- ESAS (2)
  • Eemian (3)
  • Eli Rabett (5)
  • Elizabeth Kolbert (1)
  • Ellesmere (1)
  • ENSO (11)
  • Eric Rignot (1)
  • Extreme weather events (15)
  • Ferrel cells (1)
  • First Nations (9)
  • Flooding (7)
  • floods (1)
  • Forest fires (3)
  • fracking (47)
  • Fred Singer (1)
  • freshwater lens (1)
  • fugitive emissions (2)
  • Gareth Renowden (2)
  • Gavin Schmidt (3)
  • Geoengineering (1)
  • George Monbiot (2)
  • Gerald Meehl (2)
  • glacial runoff (1)
  • Global dimming (1)
  • glyphosate (1)
  • Graham Readfearn (9)
  • Greenland ice melt (21)
  • Greenpeace (3)
  • Greg Laden (3)
  • GrIS (9)
  • Hadley cells (2)
  • Hadley circulation (2)
  • Hans Joachim Schellnhuber (1)
  • Harrison Loony Tool Schmitt (1)
  • Heartland Institute (14)
  • heat dome (3)
  • Heat waves (13)
  • hockey stick (10)
  • Holocene thermal maximum (2)
  • hurricanes (1)
  • IceSat (2)
  • Igor Semiletov (4)
  • Inhofe (2)
  • Insurers (2)
  • Intertropical Convergence Zone - ICZ (2)
  • Jakobshavn Isbræ (1)
  • James Hansen (15)
  • Jason Box (10)
  • Jeff Masters (6)
  • Jennifer Francis (7)
  • Jeremy Grantham (1)
  • Jet stream (4)
  • John Abraham (15)
  • John Christy (1)
  • John Cook (2)
  • John Kerry (2)
  • Joseph Romm (12)
  • Josh Willis (2)
  • Judith Curry (1)
  • Julie Brigham-Grette (1)
  • Justin Gillis (3)
  • Katharine Hayhoe (2)
  • Kerry Emanuel (2)
  • Kevin Grandia (1)
  • Kevin Trenberth (14)
  • Keystone Principle (14)
  • Keystone XL (57)
  • Koch Industries (13)
  • Konrad Steffen (2)
  • Lake El'gygytgyn (1)
  • Leo Hickman (2)
  • Marc Morano (3)
  • Mark Boslough (1)
  • Mark Hertsgaard (1)
  • Mark Serreze (1)
  • Mass extinctions (1)
  • Mauri Pelto (1)
  • Medieval Climate Anomaly (2)
  • Meridonal heat transport - MHT (1)
  • Methane (2)
  • Methane Gun hypothesis (9)
  • Methane hydrates (11)
  • Michael Mann (20)
  • Michael Oppenheimer (2)
  • Michael Tobis (2)
  • Milne Ice Shelf (1)
  • Mitigation (1)
  • Monckton (6)
  • Monsanto (3)
  • Myles Allen (1)
  • Naomi Klein (1)
  • Natalia Shakhova (4)
  • national security (3)
  • Neela Banerjee (1)
  • neonicotinoid pesticide (9)
  • Nitrous oxide (1)
  • North Atlantic meridional overturning circulation (1)
  • North Atlantic Oscillation (2)
  • Obama (1)
  • OccupyWallStreet (5)
  • ocean acidification (2)
  • Ocean chemistry (1)
  • ocean heat content (15)
  • Ocean salinity (2)
  • Ocean temperatures (4)
  • ozone levels (1)
  • paleo-climate (4)
  • Paleo-CO2 (2)
  • Patrick Michaels (1)
  • Paul Douglas (1)
  • PDO - Pacific Decadal Oscillation (4)
  • Peak food (10)
  • Peak oil (1)
  • Peak Water (3)
  • Permafrost (1)
  • Permafrost - subsea (2)
  • Permian mass extinction (1)
  • Peter Gleick (3)
  • Peter Sinclair (13)
  • Peter Wadhams (4)
  • Petermann Glacier (1)
  • Phil Jones (1)
  • Pinatubo rebound effect (2)
  • pine beetles (1)
  • Pine Island Glacier (1)
  • PIOMAS (3)
  • polar bears (5)
  • Polar jet stream (8)
  • Polar vortex (2)
  • Positive feedbacks (1)
  • Precipitation extremes (4)
  • radiative forcing (2)
  • Ray Weymann (1)
  • Raypierre (1)
  • resilience (1)
  • resource scarcity (3)
  • Richard Alley (3)
  • Richard Somerville (1)
  • Rick Piltz (2)
  • Robert Corell (1)
  • Roger Pielke Jr. (1)
  • Rossby waves (2)
  • Russia (1)
  • saltwater intrusion (1)
  • Scott Mandia (1)
  • Sea level rise (13)
  • sea surface temperature anomalies (1)
  • Sediment cores (2)
  • Shell Oil (4)
  • snow cover (3)
  • Snowden (1)
  • Solar activity (1)
  • solar radiation (1)
  • Soot (3)
  • Stefan Rahmstorf (5)
  • Steve Horn (13)
  • Storm intensity (1)
  • Storm tracks diverted polewards (1)
  • Stratospheric Sudden Warmings (3)
  • sulfoxaflor (1)
  • Tamino (1)
  • tar sands (57)
  • Ted Scambos (1)
  • Terracide (1)
  • These people are completely insane (7)
  • Thomas L. Friedman (2)
  • threat multiplier (1)
  • Threat to our democracy (49)
  • Tim DeChristopher (1)
  • Tipping elements (1)
  • Tom Steyer (1)
  • Tornado statistics (2)
  • TransCanada (3)
  • trees (1)
  • tropospheric water vapor (1)
  • Typhoon Yasi (1)
  • Van Jones (2)
  • volcanism (1)
  • WAIS (1)
  • Waleed Abdalati (1)
  • Walker circulation (2)
  • Walt Meier (1)
  • Water shortage (2)
  • William Krabill (1)
  • Willie Soon (1)
  • Wind pattern changes (2)
  • Wind power (2)

Blog Archive

  • ▼  2013 (500)
    • ▼  September (27)
      • James Hansen: Tar Sands and Dirty Tricks
      • Summer 2013 weather extremes tied to extraordinari...
      • Court rulings show judges accept climate science
      • DC judge denies another effort to derail Michael M...
      • Scientist Michael Mann named in top 10 influential...
      • Justin Gillis, NYT: A Climate Alarm, Too Muted for...
      • Top Obama aide Heather Zichal worked the Pavillion...
      • Call Sacramento. Vote NO on SB4
      • Graham Readfearn: The undiscerning climate bookshelf
      • Graham Readfearn: Australia's Department of Defenc...
      • Top Occupy Wall Street Cartoons
      • URGENT: phone your CA rep to prevent industry amen...
      • Tom Steyer, NexGen: Keystone XL bad economics for ...
      • Daily Mail Lies! No 60% recovery in Arctic sea ice...
      • Steve Horn: The Flip Side of Obama’s Keystone XL D...
      • Joseph E. Stiglizt, NYT: Why Janet Yellen, Not Lar...
      • "Global crop exposure to critical high temperature...
      • Naomi Klein: Green groups may be more damaging th...
      • Margaret Heffernan: Dare to Disagree
      • "Spring snow cover extent reductions in the 2008-2...
      • U.S. Becomes Largest Wood Pellet Exporter,Enviva, ...
      • Rebuttal to Michael Tobis' unsubstantiated attacks...
      • Why trust climate models? It’s a matter of simple ...
      • Steve Horn: "Frackademia" By Law: Section 999 of t...
      • MUST SEE, Peter Sinclair: No Slowdown in Global Wa...
      • Dana Nuccitelli: The Pacific Ocean fills in anothe...
      • Posts from August 2013
    • ►  August (78)
    • ►  July (74)
    • ►  June (56)
    • ►  May (62)
    • ►  April (105)
    • ►  March (98)
Powered by Blogger.

About Me

Unknown
View my complete profile