TheNextGeneration

  • Subscribe to our RSS feed.
  • Twitter
  • StumbleUpon
  • Reddit
  • Facebook
  • Digg
Showing posts with label Atmospheric CO2. Show all posts

Sunday, June 16, 2013

Elizabeth Kolbert: Lines in the Sand

Posted on 9:08 PM by Unknown
by Elizabeth Kolbert, The New Yorker, May 27, 2013

A lot of what’s known about carbon dioxide in the atmosphere can be traced back to a chemist named Charles David Keeling, who, in 1958, persuaded the U.S. Weather Bureau to install a set of monitoring devices at its Mauna Loa observatory, on the island of Hawaii. By the 1950s, it was well understood that, thanks to the burning of fossil fuels, humans were adding vast amounts of carbon to the air. But the prevailing view was that this wouldn’t much matter, since the oceans would suck most of it out again. Keeling thought that it would be prudent to find out if that was, in fact, the case. The setup on Mauna Loa soon showed that it was not.

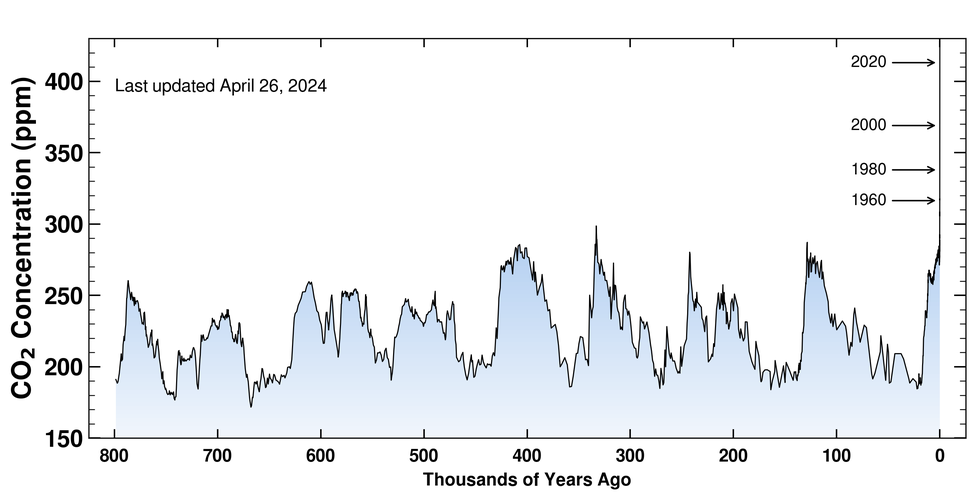
Carbon-dioxide levels have been monitored at the observatory ever since, and they’ve exhibited a pattern that started out as terrifying and may be now described as terrifyingly predictable. They have increased every year, and earlier this month they reached the milestone of 400 parts per million. No one knows exactly when CO2 levels were last this high; the best guess is the mid-Pliocene, about three million years ago. At that point, summertime temperatures in the Arctic were 14 degrees warmer than they are now and sea levels were some 75 feet higher.

When the milestone was passed, Keeling’s son Ralph, a geochemist at the Scripps Institution of Oceanography, glossed the event as follows: “It means we are quickly losing the possibility of keeping the climate below what people thought were possibly tolerable thresholds.” 


Maureen Raymo, a marine geologist at the Lamont-Doherty Earth Observatory, was more blunt. “It feels like the inevitable march toward disaster,” she told the Times.

President Obama will make a decision in the next few months—unless he puts it off again, as he did in 2011—about whether to approve the Keystone XL pipeline. The question before him is whether it’s in the “national interest” to grant the permits needed for constructing Keystone, which is supposed to dogleg from Alberta to Nebraska, and join a pipeline that will extend to Texas, connecting Canada’s tar-sands deposits with American refineries. The latest figures from Mauna Loa reveal what’s at stake.

Last week, as the President was otherwise engaged—with the uproar over the I.R.S., the Justice Department’s subpoena of phone records from the Associated Press, and the e-mails about the attack on the American consulate in Benghazi—lobbying for the pipeline reached a new level of intensity. At the start of the week, the Canadian government launched an ad campaign to build support for the pipeline in the U.S. One ad, featuring construction workers fitting sections of pipe, says, “America and Canada: Standing together for energy independence.” Although the Canadians have not released the cost of the campaign, the Globe and Mail reported that Canada’s natural-resources department has set aside more than US$16 million for advertising this year. (Canada’s natural-resources minister, Joe Oliver, recently travelled to France and England to push the tar sands; he ended up threatening the European Union, which is considering labelling tar-sands oil as “highly polluting,” with taking the case to the World Trade Organization.) Then, at the end of the week, Canada’s Prime Minister, Stephen Harper, came to New York to make the pitch himself. “All the facts are overwhelmingly on the side of approval,” he said, at the Council on Foreign Relations. With a touch of menace, he added, “I know the Administration will do a thorough analysis before arriving at the right decision.”

The arguments in favor of Keystone run more or less like this: Americans use a lot of oil—more than 18 million barrels per day. It has to come from somewhere, and Canada is a more reliable trading partner than, say, Iraq. The U.S. already imports roughly a million barrels of Canadian tar-sands oil a day, and if it doesn’t import the rest, some other country will. “It’s overwhelmingly likely the oil would find another way to market,” USA Today observed in a recent editorial. For instance, a pipeline could be built to British Columbia, and the oil shipped from there to China, though there are many political and logistic barriers to such a plan—among them the Canadian Rockies.

If the arguments in favor of Keystone are persuasive, those against it are even stronger. 


Tar-sands oil is not really oil, at least not in the conventional sense of the word. It starts out as semi-solid and has to be either mined or literally melted out of the ground. In either case, the process requires energy, which is provided by burning fossil fuels. The result is that, for every barrel of tar-sands oil that’s extracted, significantly more carbon dioxide enters the air than for every barrel of ordinary crude—between 12% and 23% more.

Alberta’s tar sands contain an estimated 1.7 trillion barrels of oil. Assuming that only a tenth of that is recoverable, it’s still enough to generate something like 22 billion metric tons of carbon. There are, it should be noted, plenty of other ways to produce 22 billion metric tons of carbon. Consuming about a seventh of the world’s remaining accessible reserves of conventional oil would do it, as would combusting even a small fraction of the world’s remaining coal deposits. Which is just the point.

Were we to burn through all known fossil-fuel reserves, the results would be unimaginably bleak: major cities would be flooded out, a large portion of the world’s arable land would be transformed into deserts, and the oceans would be turned into liquid dead zones. If we take the future at all seriously, which is to say as a time period that someone is going to have to live in, then we need to leave a big percentage of the planet’s coal and oil and natural gas in the ground. These basic facts have been established for decades, and every President since George Bush senior has vowed to do something to avert catastrophe. The numbers from Mauna Loa show that they have failed.

In rejecting Keystone, President Obama would not solve the underlying problem, which, as pipeline proponents correctly point out, is consumption. Nor would he halt exploitation of the tar sands. But he would put a brake on the process. After all, if getting tar-sands oil to China were easy, the Canadians wouldn’t be applying so much pressure on the White House. Once Keystone is built, there will be no putting the tar back in the sands. The pipeline isn’t inevitable, and it shouldn’t be treated as such. It’s just another step on the march to disaster.

http://newyorker.com/talk/comment/2013/05/27/130527taco_talk_kolbert
Read More
Posted in Atmospheric CO2, Elizabeth Kolbert, Keystone XL, tar sands | No comments

Wednesday, May 15, 2013

Financial Times: Climate Chaos

Posted on 3:42 PM by Unknown

Why the world faces climate chaos

Martin Wolf by Martin Wolf, Financial Times, May 15, 2013

We will watch the rise in greenhouse gases until it is too late to do anything about it

Last week the concentration of carbon dioxide in the atmosphere was reported to have passed 400 parts per million for the first time in 4.5 million years. It is also continuing to rise at a rate of about 2 ppm every year. On the present course, it could be 800 ppm by the end of the century. Thus, all the discussions of mitigating the risks of catastrophic climate change have turned out to be empty words.


Collectively, humanity has yawned and decided to let the dangers mount. Professor Sir Brian Hoskins, director of the Grantham Institute for Climate Change at Imperial College in London, notes that when the concentrations were last this high, “the world was warmer on average by three or four degrees Celsius than it is today. There was no permanent ice sheet on Greenland, sea levels were much higher, and the world was a very different place, although not all of these differences may be directly related to CO2 levels.”

His caveat is proper. Nonetheless, the greenhouse effect is basic science: it is why the earth has a more pleasant climate than the moon. CO2 is a known greenhouse gas. There are positive feedback effects from rising temperatures, via, for example, the quantity of water vapour in the atmosphere. In brief, humanity is conducting a huge, uncontrolled and almost certainly 
irreversible climate experiment with the only home it is likely to have. Moreover, if one judges by the basic science and the opinions of the vast majority of qualified scientists, risk of calamitous change is large.

What makes the inaction more remarkable is that we have been hearing so much hysteria about the dire consequences of piling up a big burden of public debt on our children and grandchildren. But all that is being bequeathed is financial claims of some people on other people. If the worst comes to the worst, a default will occur. Some people will be unhappy. 

But life will go on. Bequeathing a planet in climatic chaos is a rather bigger concern. There is nowhere else for people to go and no way to reset the planet’s climate system. If we are to take a prudential view of public finances, we should surely take a prudential view of something irreversible and much costlier.

So why are we behaving like this?

The first and deepest reason is that, as the civilisation of ancient Rome was built on slaves, ours is built on fossil fuels. What happened in the beginning of the 19th century was not an “industrial revolution” but an “energy revolution.” Putting carbon into the atmosphere is what we do. As I have argued in Climate Policy, what used to be the energy-intensive lifestyle of today’s high-income countries has gone global. Economic convergence between emerging and high-income countries is increasing demand for energy faster than improved energy efficiency is reducing it. Not only aggregate CO2 emissions but even emissions per head are rising. The latter is partly driven by China’s reliance on coal-powered electricity generation. (See charts.)

A second reason is opposition to any interventions in the free market. Some of this, no doubt, is driven by narrowly economic interests. But do not underestimate the power of ideas. To admit that a free economy generates a vast global external cost is to admit that the large-scale government regulation so often proposed by hated environmentalists is justified. For many libertarians or classical liberals, the very idea is unsupportable. It is far easier to deny the relevance of the science.

A symptom of this is clutching at straws. It is noted, for example, that average global temperatures have not risen recently, though they are far higher than a century ago. Yet periods of falling temperature within a rising trend have occurred before.

A third reason may be the pressure of responding to immediate crises that has consumed almost all the attention of policy makers in the high-income countries since 2007.

A fourth is a touching confidence that, should the worst comes to the worst, human ingenuity will find some clever ways of managing the worst results of climate change.

A fifth is the complexity of reaching effective and enforceable global agreements on the control of emissions among so many countries. Not surprisingly, the actual agreements reached give more an appearance of action than a reality.

A sixth is indifference to the interests of people to be born in a relatively distant future. As the old line goes: “Why should I care about future generations? What have they ever done for me?”

A final (and related) reason is the need to strike a just balance between poor countries and rich ones and between those who emitted most of the greenhouse gases in the past and those who will emit in the future.

The more one thinks about the challenge, the more impossible it is to envisage effective action. We will, instead, watch the rise in global concentrations of greenhouse gases. If it turns out to lead to a disaster, it will by then be far too late to do anything much about it.
So what might shift such a course? My view is, increasingly, that there is no point in making moral demands. People will not do something on this scale because they care about others, even including their own more remote descendants. They mostly care rather too much about themselves for that.

Most people believe today that a low-carbon economy would be one of universal privation. They will never accept such a situation. This is true both of the people of high-income countries, who want to retain what they have, and the people of the rest of the world, who want to enjoy what the people of high-income countries now have. A necessary, albeit not sufficient condition, then, is a politically sellable vision of a prosperous low-carbon economy. That is not what people now see. Substantial resources must be invested in the technologies that would credibly deliver such a future.

Yet that is not all. If such an opportunity does appear more credible, institutions must also be developed that can deliver it.

Neither the technological nor the institutional conditions exist at present. In their absence, there is no political will to do anything real about the process driving our experiment with the climate. Yes, there is talk and wringing of hands. But there is, predictably, no effective action. If that is to change, we must start by offering humanity a far better future. Fear of distant horror is not enough.

martin.wolf@ft.com

http://www.ft.com/cms/s/0/c926f6e8-bbf9-11e2-a4b4-00144feab7de.html
Read More
Posted in Atmospheric CO2, Catastrophic climate change | No comments

Sunday, May 12, 2013

Climate Sensitivity Stunner: Last Time CO2 Levels Hit 400 Parts Per Million The Arctic Was 14 °F Warmer!

Posted on 2:25 PM by Unknown
by Joe Romm, Climate Progress, May 12, 2013
We have pushed atmospheric CO2 levels to 400 parts per million (ppm) for the first time in human existence.
At the same time, a truly remarkably set of paleoclimate data shows the climate is much more sensitive to CO2 than we thought. And that means returning as quickly as possible back to 350 ppm is a vastly more rational course of action for a non-suicidal civilization, than, say continuing our unrestrained march toward 600 ppm, then 800, and then 1,000.
NOAA reported Friday that the daily mean concentration of CO2 in the air around Mauna Loa, Hawaii, surpassed 400 parts per million this week:
At the same time, a major new Science study of paleoclimate temperatures — based on “the longest sediment core ever collected on land in the Arctic” – revealed what happened the last time we had similar CO2 levels:
“One of our major findings is that the Arctic was very warm in the Pliocene [~5.3 to 2.6 million years ago] when others have suggested atmospheric CO2 was very much like levels we see today. This could tell us where we are going in the near future. In other words, the Earth system response to small changes in carbon dioxide is bigger than suggested by earlier models,” the authors state.
Yes, contrary to one or two (misreported) models suggesting a climate sensitivity on the low side, this study joins the myriad analyses of data that find it is likely to prove to be on the high side. For instance, recent observations of relative humidity in the tropics and subtropics found that “Future warming likely to be on high side of climate projections,” according to a November paper in Science.
How sensitive is the climate to increases in CO2, according to this “absolutely new knowledge” of paleoclimate temperatures?
Another significant finding to emerge from this first continuous, high-resolution record of the Middle Pliocene is documentation of sustained warmth with summer temperatures of about 59–61 
°F [15–16 °C], about 8 °C [14 °F] warmer than today.
This period of Arctic warmth “coincides, in part, with a long interval of 1.2 million years when the West Antarctic Ice sheet did not exist.” Indeed, sea levels during the mid-Pliocine were about 25 m [82 feet] higher than today!
It is worth noting that a 2009 analysis in Science found that when CO2 levels were this high 15–20 million years ago, it was 5–10 °F warmer globally and seas were also 75–120 feet higher.
The risks of failing to sharply curtail carbon pollution are enormous if the climate sensitivity is on the low side (see “Memo To Media: ‘Climate Sensitivity’ Is NOT The Same As Projected Future Warming, World Faces 10 °F Rise”). But the risks of inaction are beyond incalculable if climate sensitivity is in the middle end of the range, let alone the high end suggested by the paleoclimate data:
Science (1/11) study — On our current emissions path, CO2 levels in 2100 will hit levels last seen when the Earth was 29 °F (16 °C) hotter: Paleoclimate data suggests CO2 “may have at least twice the effect on global temperatures than currently projected by computer models.”
As I explained in Nature online back in 2008 (here), once you factor in carbon-cycle feedbacks, even the uber-cautious Fourth Assessment report (AR4) of the IPCC makes clear we are headed toward 1,000 ppm (the A1FI scenario). That conclusion has been supported by just about every major independent analysis, including a recent report by PricewaterhouseCoopers (see Study: We’re Headed To 11 °F Warming And Even 7 °F Requires “Nearly Quadrupling The Current Rate Of Decarbonisation”).
This new paper is just the latest to suggest the Arctic will warm much faster than the models have suggested. For instance, back in 2006, scientists analyzed deep marine sediments to understand the Paleocene Eocene thermal maximum, a brief period some 55 million years ago of “widespread, extreme climatic warming that was associated with massive atmospheric greenhouse gas input.” That Nature study (subs. req’d) found Arctic temperatures almost beyond imagination – above 23 °C (74 °F) – temperatures more than 18 °F warmer than climate models had predicted when applied to this period. The three dozen authors conclude that existing climate models are missing crucial feedbacks that can significantly amplify polar warming.
Clearly our climate models don’t do a good job of explaining what’s happening in the Arctic right now:
Arctic sea ice is melting much, much faster than even the best climate models had projected (actual observations in red). The reason is most likely unmodeled amplifying feedbacks. The image (from Climate Crocks via Arctic Sea Ice Blog) comes from a 2007 GRL research paper by Stroeve et al.
And this underestimation of polar amplification in turn leads the authors of the new study — and many other scientists — to conclude that the climate’s overall sensitivity is on the high side. As the UK Guardian reports:
Prof Robert Spicer, at the Open University and not part of the new study, agreed: “This is another piece of evidence showing that climate models have a systematic problem with polar amplification,” i.e., the fact that global warming has its greatest effects at the poles. “This has enormous implications and suggests model are likely to underestimate the degree of future change.”
Given that the Arctic is already losing ice several decades faster than any major climate model had projected, we should expect that the permafrost — which contains twice as much carbon as the atmosphere currently does — will also go faster than the models suggest.
Indeed, a 2008 study by leading tundra experts found “Accelerated Arctic land warming and permafrost degradation during rapid sea ice loss.” The study’s ominous conclusion:
We find that simulated western Arctic land warming trends during rapid sea ice loss are 3.5 times greater than secular 21st century climate-change trends. The accelerated warming signal penetrates up to ,km inland….
This in turn suggests that the extra warming from the released permafrost carbon will be on the high side (see “Carbon Feedback From Thawing Permafrost Will Likely Add 0.4–1.5 °F To Total Global Warming By 2100”).
Anyone betting on a low sensitivity of the climate to carbon is literally betting against history.
Finally, this new analysis of Arctic sediments is a very impressive piece of work whose conclusions are hard to dismiss:
“It shows a huge warming – unprecedented in human history,” said Prof Scott Elias, at Royal Holloway University of London, and not involved in the work. “It is a frightening experiment we are conducting with our climate.”
The sediments have been slowly settling in Lake El’gygytgyn since it was formed 3.6 million years ago, when a kilometre-wide meteorite blasted a crater 100 km north of the Arctic circle. Unlike most places so far north, the region was never eroded by glaciers, so a continuous record of the climate has lain undisturbed ever since. “It’s a phenomenal record,” said Prof Peter Sammonds, at University College London. “It is also an incredible achievement [the study's work], given the remoteness of the lake.” Sixteen shipping containers of equipment had to be hauled 90 km over snow by bulldozers from the nearest ice road, used by gold miners.
Previous research on land had revealed glimpses of the Arctic climate and ocean sediments had recorded the marine climate, but the disparate data are not consistent with one another. “Lake El’gygytgyn may be the only place in the world that has this incredible unbroken record of sediments going back millions of years,” said Elias. “When you have a very long record it is very different to argue with.”
If you want to learn more about this research, you can read the news release, the study itself (subs. req’d) or watch this video from the lead author, where you will also learn how to pronounce “El’gygytgyn”:
http://thinkprogress.org/climate/2013/05/12/1993531/climate-sensitivity-stunner-last-time-co2-levels-hit-400-parts-per-million-the-arctic-was-14f-warmer/
Read More
Posted in Arctic amplification, Atmospheric CO2, Climate sensitivity, Joseph Romm, Methane hydrates, Permafrost - subsea, Sediment cores | No comments

Friday, May 10, 2013

CO2 in atmosphere reaches 400 ppm for first time in human history

Posted on 10:46 AM by Unknown
Global carbon dioxide in atmosphere passes milestone level 

by Damian Carrington, The Guardian, May 10, 2013 

MAUNA LOA OBSERVATORY 
Hawaii's Mauna Loa observatory, where record CO2 increases are being documented. Photograph: Richard Vogel/AP 

For the first time in human history, the concentration of climate-warming carbon dioxide in the atmosphere has passed the milestone level of 400 parts per million (ppm). The last time so much greenhouse gas was in the air was several million years ago, when the Arctic was ice-free, savannah spread across the Sahara desert and sea level was up to 40 metres higher than today.

These conditions are expected to return in time, with devastating consequences for civilisation, unless emissions of CO2 from the burning of coal, gas and oil are rapidly curtailed. But despite increasingly severe warnings from scientists and a major economic recession, global emissions have continued to soar unchecked.
"It is symbolic, a point to pause and think about where we have been and where we are going," said Professor Ralph Keeling, who oversees the measurements on a Hawaian volcano, which were begun by his father in 1958. "It's like turning 50: it's a wake up to what has been building up in front of us all along."
"The passing of this milestone is a significant reminder of the rapid rate at which – and the extent to which – we have increased the concentration of greenhouse gases in the atmosphere," said Prof Rajendra Pachauri, chair of the Intergovernmental Panel on Climate Change, which serves as science adviser to the world's governments. "At the beginning of industrialisation the concentration of CO2 was just 280ppm. We must hope that the world crossing this milestone will bring about awareness of the scientific reality of climate change and how human society should deal with the challenge."
The world's governments have agreed to keep the rise in global average temperature, which have already risen by over 1 C, to 2 C, the level beyond which catastrophic warming is thought to become unstoppable. But the International Energy Agency warned in 2012 that on current emissions trends the world will see 6 C of warming, a level scientists warn would lead to chaos. With no slowing of emissions seen to date, there is already mounting pressure on the UN summit in Paris in 2015, which is the deadline set to settle a binding international treaty to curb emissions.
Edward Davey, the UK's energy and climate change secretary, said: "This isn't just a symbolic milestone, it's yet another piece of clear scientific evidence of the effect human activity is having on our planet. I've made clear I will not let up on efforts to secure the legally binding deal the world needs by 2015 to avoid the worst effects of climate change."
Two CO2 monitoring stations high on the Hawaiian volcano of Mauna Loa are run by the US National Oceanic and Atmospheric Administration and the Scripps Institution of Oceanography and provide the global benchmark measurement. Data released on Friday shows the daily average has passed 400 ppm for the first time in its half century of recording. The level peaks in May each year as the CO2 released by decaying vegetation is taken up by renewed plant growth in the northern hemisphere, where the bulk of plants grow.
Analysis of fossil air trapped in ancient ice and other data indicate that this level has not been seen on Earth for 3–5 million years, a period called the Pliocene. At that time, global average temperatures were 3 or 4C higher than today's and 8C warmer at the poles. Reef corals suffered a major extinction while forests grew up to the northern edge of the Arctic Ocean, a region which is today bare tundra.
"I think it is likely that all these ecosystem changes could recur," said Richard Norris, a colleague of Keeling's at Scripps. The Earth's climate system takes time to adjust to the increased heat being trapped by high greenhouse levels and it may take hundreds of years for the great ice caps in Antarctica and Greenland to melt to the small size of the Pliocence and sea level far above many of the world's major cities.
But the extreme speed at which CO2 in now rising – perhaps 75 times faster than in pre-industrial time – has never been seen in geological records and some effects of climate change are already being seen, with extreme heatwaves and flooding now more likely. Recent wet and cold summer weather in Europe has been linked to changes in the high level jetstream winds, in turn linked to the rapidly melting sea ice in the Arctic, which shrank to its lowest recorded level in September.
"We are creating a prehistoric climate in which human societies will face huge and potentially catastrophic risks," said Bob Ward, policy director at the Grantham Research Institute on Climate Change at the London School of Economics. "Only by urgently reducing global emissions will we be able to avoid the full consequences of turning back the climate clock by 3 million years."
"The 400ppm threshold is a sobering milestone and should serve as a wake up call for all of us to support clean energy technology and reduce emissions of greenhouse gases, before it's too late for our children and grandchildren," said Tim Lueker, a carbon cycle scientist at Scripps.
Professor Bob Watson, former IPCC chair and UK government chief scientific adviser, said: "Passing 400 ppm of carbon dioxide in the atmosphere is indeed a landmark and the rate of increase is faster than ever and shows no sign of abating due to a lack of political commitment to address the urgent issue of climate change – the world is now most likely committed to an increase in surface temperature of 3–5 C compared to pre-industrial times."
The graph of the rising CO2 at Mauna Loa is known as the Keeling curve, after the late Dave Keeling, the scientist who began the measurements in March 1958. The isolated Hawaiian island is a good location for measurements as it is far from the main sources of CO2, meaning it represents a good global average.
Keeling curveClimate-warming gas in atmosphere passes 400ppm milestone – interactive Link: http://www.guardian.co.uk/environment/2013/may/10/carbon-dioxide-highest-level-greenhouse-gas
Read More
Posted in Atmospheric CO2 | No comments

Saturday, April 20, 2013

Andrew Glikson: Another link between CO2 and mass extinctions of species

Posted on 10:56 AM by Unknown

by Andrew Glikson, The Conversation, March 22, 2013

It’s long been known that massive increases in emission of CO2 from volcanoes, associated with the opening of the Atlantic Ocean in the end-Triassic Period, set off a shift in state of the climate which caused global mass extinction of species, eliminating about 34% of genera. The extinction created ecological niches which allowed the rise of dinosaurs during the Triassic, about 250–200 million years ago.

New research released this morning in Science Express has refined the dating of this wave of volcanism. It shows marine and land species disappear from the fossil record within 20,000 to 30,000 years from the time evidence for the eruption of large magma flows appears, approximately 201 million years ago. These volcanic eruptions increased atmospheric CO2 and increased ocean acidity.

Mass extinctions due to rapidly escalating levels of CO2 are recorded since as long as 580 million years ago. As our anthropogenic global emissions of CO2 are rising, at a rate for which no precedence is known from the geological record with the exception of asteroid impacts, another wave of extinctions is unfolding.

Mass extinctions of species in the history of Earth include:
  • the ~580 million years-old (Ma) Acraman impact (South Australia) and Acrytarch (ancient palynomorphs) extinction and radiation
  • Late Devonian (~374 Ma) volcanism, peak global temperatures and mass extinctions
  • the end-Devonian impact cluster associated with mass extinction, which among others destroyed the Kimberley Fitzroy reefs (~360 Ma)
  • the upper Permian (~267 Ma) extinction associated with a warming trend
  • the Permian-Triassic boundary volcanic and asteroid impact events (~ 251 Ma) and peak warming
  • the End-Triassic (201 Ma) opening of the Atlantic Ocean, and massive volcanism
  • an End-Jurassic (~145 Ma) impact cluster and opening of the Indian Ocean
  • the Cretaceous–Tertiary boundary (K-T) (~65 Ma) impact cluster, Deccan volcanic activity and mass extinction
  • the pre-Eocene–Oligocene boundary (~34 Ma) impact cluster and a cooling trend, followed by opening of the Drake Passage between Antarctica and South America, formation of the Antarctic ice sheet and minor extinction at ~34 Ma.
Throughout the Phanerozoic (from 542 million years ago), major mass extinctions of species closely coincided with abrupt rises of atmospheric carbon dioxide and ocean acidity. These increases took place at rates to which many species could not adapt. These events – triggered by asteroid impacts, massive volcanic activity, eruption of methane, ocean anoxia and extreme rates of glaciation (see Figures 1 and 2) – have direct implications for the effects of the current rise of CO2.


Click on graphs to enlarge.

Figure 1. Trends in atmospheric CO2 and related glacial and interglacial periods since the Cambrian (542 million years ago), showing peaks in CO2 levels (green diamonds) associated with asteroid impacts and/or massive volcanism. CO2 data from Royer (2004 and 2006).


Figure 2. Relations between CO2 rise rates and mean global temperature rise rates during warming periods, including the Paleocene–Eocene Thermal Maximum, early Oligocene, mid-Miocene, late Pliocene, Eemian (glacial termination), Dansgaard–Oeschger cycles, Medieval Warming Period, 1750–2012 and 1975–2012 periods.

In February 2013, CO2 levels had risen to near 396.80 ppm at Mauna Loa Atmospheric Observatory, compared to 393.54 ppm in February 2012. This rise (3.26 ppm per year) is at the highest rate yet recorded. Further measurements show CO2 is at near 400 ppm of the atmosphere over the Arctic. At this rate the upper stability threshold of the Antarctic ice sheet, defined at about 500–600 ppm CO2 would be reached later this century (although hysteresis of the ice sheets may slow down melting).

Our global carbon reserves (including coal, oil, oil shale, tar sands, gas and coal-seam gas) contain considerably more than 10,000 billion tonnes of carbon (see Figure 5). This amount of carbon, if released into the atmosphere, is capable of raising atmospheric CO2 levels to higher than 1,000 ppm. Such a rise in atmospheric radiative forcing will be similar to that of the Paleocene–Eocene boundary thermal maximum (PETM), which happened about 55 million years ago (see Figures 1, 2 and 4). But the rate of rise surpasses those of this thermal maximum by about ten times.


Figure 3. Plot of percent mass extinction of genera versus peak atmospheric CO2 levels at several stages of Earth history.


Figure 4. The Paleocene–Eocene Thermal Maximum (PETM) represented by sediments in the Southern Ocean, central Pacific and South Atlantic oceans. The data indicate: (a) deposition of an organic matter-rich layer consequent on extinction of marine organisms, (b) lowering of δ18O values representing an increase in temperature, and (c) a sharp decline in carbonate contents of sediments representing a decrease in pH and increase in acidity (Zachos et al. 2008).

The Paleocene–Eocene boundary thermal maximum event about 55 million years ago saw the release of approximately 2,000–3,000 billion tons of carbon to the atmosphere in the form of methane (CH4). It led to the extinction of about 35–50% of benthic foraminifera (see Figures 3 and 4), representing a major decline in the state of the marine ecosystem. The temperature rise and ocean acidity during this event are shown in Figures 4 and 6.

Based on the amount of carbon already emitted and which could continue to be released to the atmosphere (see Figure 5), current climate trends could be tracking toward conditions like those of the Paleocene–Eocene event. Many species may be unable to adapt to the extreme rate of current rise in greenhouse gases and temperatures. The rapid opening of the Arctic Sea ice, melting of Greenland and west Antarctic ice sheets, and rising spate of floods, heat waves, fires and other extreme weather events may signify a shift in the state of the climate, crossing tipping points.


Figure 5. CO2 emissions from fossil fuels (2.12 GtC ~ 1 ppm CO2). Estimated reserves and potentially recoverable resources.

By analogy to medical science analysing blood count as diagnosis for cancer, climate science uses the greenhouse gas levels of the atmosphere, pH levels of the ocean, variations in solar insolation, aerosol concentrations, clouding states at different levels of the atmosphere, state of the continental ice sheets and sea ice, position of high pressure ridges and climate zones and many other parameters to determine trends in the climate. The results of these tests, conducted by thousands of peer-reviewed scientists world-wide, have to date been ignored, at the greatest peril to humanity and nature.

Continuing emissions contravene international laws regarding crimes against humanity and related International and Australian covenants. In the absence of an effective global mitigation effort, governments world-wide are now presiding over the demise of future generations and of nature, tracking toward one of the greatest mass extinction events nature has seen. It is time we learned from the history of planet Earth.


Figure 6. The Paleocene–Eocene boundary thermal maximum. http://www.uta.edu/faculty/awinguth/petm_research/petm_home.html

Andrew Glikson does not work for, consult to, own shares in or receive funding from any company or organisation that would benefit from this article, and has no relevant affiliations.

The Conversation
This article was originally published at The Conversation. Read the original article.
Read More
Posted in Andrew Glikson, Atmospheric CO2, Dansgaard–Oeschger event, Eemian, Mass extinctions, Medieval Climate Anomaly, paleo-climate, Paleo-CO2, Permian mass extinction | No comments

Sunday, March 31, 2013

James Hansen: Doubling Down on Our Faustian Bargain

Posted on 8:26 PM by Unknown

by James Hansen, Pushker Kharecha and Makiko Sato, Huffington Post, March 31, 2013
Humanity's Faustian climate bargain is well known. Humans have been pumping both greenhouse gases (mainly CO2) and aerosols (fine particles) into the atmosphere for more than a century. The CO2 accumulates steadily, staying in the climate system for millennia, with a continuously increasing warming effect. Aerosols have a cooling effect (by reducing solar heating of the ground) that depends on the rate that we pump aerosols into the air, because they fall out after about five days.
Aerosol cooling probably reduced global warming by about half over the past century, but the amount is uncertain because global aerosols and their effect on clouds are not measured accurately. Aerosols increased rapidly after World War II as fossil fuel use increased ~5%/year with little pollution control (Fig. 1). Aerosol growth slowed in the 1970s with pollution controls in the U.S. and Europe, but accelerated again after ~2000.
2013-03-31-ScreenShot20130331at4.09.38PM.png
Fig. 1. CO2 annual emissions from fossil fuel use and cement manufacture, update of a figure using recent data.
2013-03-31-ScreenShot20130331at4.14.12PM.png

Fig. 2. Annual increase of CO2 at Mauna Loa. The 12-month running mean reduces the double noise in the 12-month change. Blue asterisks show the end-of-year 12-month change often reported in the media.
The rapid growth of fossil fuel CO2 emissions in the past decade is mainly from increased coal use (Fig. 1), mostly in China with little control of aerosol emissions. It is thus likely that there has been an increase in the negative (cooling) climate forcing by aerosols in the past decade, as suggested by regional aerosols measurements in the Far East, but until proper global aerosol monitoring is initiated, as discussed below, the aerosol portion of the amplified Faustian bargain remains largely unquantified.
In our current paper we describe another component to the fossil fuel Faustian bargain, which is suggested by a careful look at observed atmospheric CO2 change (Fig. 2). The orange curve in Fig. 2 is the 12-month change of CO2 at Mauna Loa. This curve is quite "noisy," in part because it has double noise, being affected by short-term variability at both the start-point and end-point in taking the 12-month difference in CO2 amount. A more meaningful measure of the CO2 growth is provided by the 12-month running mean (red curve in Fig. 2). The temporal variability of the red curve has physical significance, most of the variability being accounted for by the Southern (El Nino-La Nina) Oscillation and the Pinatubo volcanic eruption in the early 1990s, as discussed in our paper.
NOAA recently reported the second largest annual CO2 increase in their Mauna Loa record. What they report is the end-of-year change in the noisy orange curve, the end-of-year values being indicated by blue asterisks in Fig. 2. It is practically certain that still larger CO2 increases will soon be reported, because of the huge increase of the rate of fossil fuel CO2 emissions in the past decade (black curve in Fig. 1), indeed we must expect reports of annual CO2 increases exceeding 3 ppm CO2.
An interesting point, however, is the failure of the observed increases in atmospheric CO2 to increase as rapidly as the fossil fuel source has increased. This fact is contrary to suggestions that terrestrial and ocean carbon sinks are tending to saturate as CO2 emissions continue.
An informative presentation of CO2 observations is the ratio of annual CO2 increase in the air divided by annual fossil fuel CO2 emissions, the "airborne fraction" (Fig. 3, right scale). This airborne fraction, clearly, is not increasing. Thus the net ocean plus terrestrial sink for carbon emissions has increased by a factor of 3 to 4 since 1958, accommodating the emissions increase by that factor.
2013-03-31-ScreenShot20130331at4.19.41PM.png
Fig. 3. Fossil fuel CO2 emissions (left scale) and airborne fraction, i.e., the ratio of observed atmospheric CO2 increase to fossil fuel CO2 emissions. Final three values are 5-, 3- and 1-year means.

Remarkably, the airborne fraction has declined since 2000. The seven-year running mean had remained close to 60% up to 2000, except for the period affected by Pinatubo. The airborne fraction is affected by factors other than the efficiency of carbon sinks, most notably by changes in the rate of fossil fuel emissions. However, the change of emission rate in 2000 from 1.5%/year to 3.1%/year (Fig. 1), other things being equal, would have caused a sharp increase of the airborne fraction (because a rapid source increase provides less time for carbon to be moved downward out of the ocean's upper layers). A decrease in land use emissions during the past decade might contribute a partial explanation for the decrease of the airborne fraction, but something more than land use change seems to be occurring.
We suggest that the surge of fossil fuel use, mainly coal, since 2000 is a basic cause of the large increase of carbon uptake by the combined terrestrial and ocean carbon sinks. One mechanism by which fossil fuel emissions increase carbon uptake is by fertilizing the biosphere via provision of nutrients essential for tissue building, especially nitrogen, which plays a critical role in controlling net primary productivity and is limited in many ecosystems. Modeling and field studies confirm a major role of nitrogen deposition, working in concert with CO2 fertilization, in causing a large increase in net primary productivity of temperate and boreal forests. A plausible addition of 5 TgN/year from fossil fuels and net ecosystem productivity of 200 kgC per kgN16 yields an annual carbon drawdown of 1 GtC/year, which is of the order of what is needed to explain the post-2000 anomaly in airborne CO2.
Independent of a possible aerosol effect on the carbon cycle, it is known that aerosols are an
important climate forcing. IPCC17 concludes that aerosols are a negative (cooling) forcing, probably between -0.5 and -2.5 W/m2. Hansen et al., based mainly on analysis of Earth's energy imbalance, derive an aerosol forcing -1.6 ± 0.3 W/m2, consistent with an analysis of Murphy et al. that suggests an aerosol forcing about -1.5 W/m2. This large negative aerosol forcing reduces the net climate forcing of the past century by about half.
Reduction of the net human-made climate forcing by aerosols has been described as a "Faustian bargain," because the aerosols constitute deleterious particulate air pollution. Reduction of the net climate forcing by half will continue only if we allow air pollution to build up to greater and greater amounts. More likely, humanity will demand and achieve a reduction of particulate air pollution, whereupon, because the CO2 from fossil fuel burning remains in the surface climate system for millennia, the "devil's payment" will be extracted from humanity via increased global warming.
So is the new data we present here good news or bad news, and how does it alter the "Faustian bargain"? At first glance there seems to be some good news. First, if our interpretation of the data is correct, the surge of fossil fuel emissions, especially from coal burning, along with the increasing atmospheric CO2 level is "fertilizing" the biosphere, and thus limiting the growth of atmospheric CO2. Also, despite the absence of accurate global aerosol measurements, it seems that the aerosol cooling effect is probably increasing based on evidence of aerosol increases in the Far East.
Both effects work to limit global warming and thus help explain why the rate of global warming seems to be less this decade than it has been during the prior quarter century. This data interpretation also helps explain why multiple warnings that some carbon sinks are "drying up" and could even become carbon sources, e.g., boreal forests infested by pine bark beetles and the Amazon rain forest suffering from drought, have not produced an obvious impact on atmospheric CO2.
However, increased CO2 uptake does not necessarily mean that the biosphere is healthier or that the increased carbon uptake will continue indefinitely. Nor does it change the basic facts about the potential magnitude of the fossil fuel carbon source and the long lifetime of fossil fuel CO2 in the surface carbon reservoirs (atmosphere, ocean, soil, biosphere) once the fossil fuels are burned. Fertilization of the biosphere affects the distribution of the fossil fuel carbon among these reservoirs, at least on the short run, but it does not alter the fact that the fossil carbon will remain in these reservoirs for millennia.
The principal implication of our present analysis relates to the Faustian bargain. Increased short-term masking of greenhouse gas warming by fossil fuel particulate and nitrogen pollution is a "doubling down" of the Faustian bargain, an increase in the stakes. The more we allow the Faustian debt to build, the more unmanageable the eventual consequences will be. Yet globally there are plans to build more than 1,000 coal-fired power plants and plans to develop some of the dirtiest oil sources on the planet. These plans should be vigorously resisted. We are already in a deep hole -- it is time to stop digging.
The tragedy of this science story is that the great uncertainty in interpretations of the climate forcings did not have to be. Global aerosol properties should be monitored to high precision, similar to the way CO2 is monitored. The capability of measuring detailed aerosol properties has long existed, as demonstrated by observations of Venus. The requirement is measurement of the polarization of reflected sunlight to an accuracy of 0.1%, with measurements covering the spectral range from near ultraviolet to the near-infrared at a range of scattering angles, as is possible from an orbiting satellite. Unfortunately, the satellite mission designed for that purpose failed to achieve orbit, suffering precisely the same launch failure as the Orbiting Carbon Observatory (OCO). Although a replacement OCO mission is in preparation, no replacement aerosol mission is scheduled.
http://www.huffingtonpost.com/dr-james-hansen/doubling-down-on-our-faustian-bargain_b_2989535.html
Read More
Posted in Aerosols, Atmospheric CO2, Carbon sinks, CO2 draw-down, ENSO, Global dimming, James Hansen, ocean heat content, Pinatubo rebound effect | No comments

Thursday, March 28, 2013

Hansen, Kharecha & Sato, ERL (2013), Climate forcing growth rates: doubling down on our Faustian bargain

Posted on 1:59 PM by Unknown
Environmental Research Letters, 7 (2012) 044035.

Perspective

Rahmstorf et al. 's (2012) conclusion that observed climate change is comparable to projections, and in some cases exceeds projections, allows further inferences if we can quantify changing climate forcings and compare those with projections. The largest climate forcing is caused by well-mixed, long-lived greenhouse gases. Here we illustrate trends of these gases and their climate forcings, and we discuss implications. We focus on quantities that are accurately measured, and we include comparison with fixed scenarios, which helps reduce common misimpressions about how climate forcings are changing.
Annual fossil fuel CO2 emissions have shot up in the past decade at about 3%/yr, double the rate of the prior three decades (Figure 1). The growth rate falls above the range of the IPCC (2001) 'Marker' scenarios, although emissions are still within the entire range considered by the IPCC SRES (2000). The surge in emissions is due to increased coal use (blue curve in Figure 1), which now accounts for more than 40% of fossil fuel CO2 emissions.

Figure 1.
Figure 1. CO2 annual emissions from fossil fuel use and cement manufacture, an update of Figure 16 of Hansen (2003) using data of British Petroleum (BP 2012) concatenated with data of Boden et al. (2012).
The resulting annual increase of atmospheric CO2 (12-month running mean) has grown from less than 1 ppm/yr in the early 1960s to an average ~2 ppm/yr in the past decade (Figure 2). Although CO2 measurements were not made at sufficient locations prior to the early 1980s to calculate the global mean change, the close match of global and Mauna Loa data for later years suggests that Mauna Loa data provide a good approximation of global change (Figure 2), thus allowing a useful estimate of annual global change beginning with the initiation of Mauna Loa measurements in 1958 by Keeling et al. (1973).

Figure 2.
Figure 2. Annual increase of CO2 based on data from the NOAA Earth System Research Laboratory (ESRL 2012). CO2 change and global temperature change are 12-month running means of differences for the same month of consecutive years. Nino index (Nino3.4 area) is 12-month running mean. Both temperature indices use data from Hansen et al. (2010). Annual mean CO2 amount in 1958 was 315 ppm (Mauna Loa) and in 2012 was 394 ppm (Mauna Loa) and 393 ppm (Global).
Interannual variability of CO2 growth is correlated with ENSO (El Nino–Southern Oscillation) variations of tropical temperatures (Figure 2). Ocean–atmosphere CO2 exchange is affected by ENSO (Chavez et al. 1999), but ENSO seems to have a greater impact on atmospheric CO2 via the terrestrial carbon cycle through effects on the water cycle, temperature, and fire, as discussed in a large body of literature (referenced, e.g., by Schwalm et al. 2011). In addition, volcanoes, such as the 1991 Mount Pinatubo eruption, slow the increase of atmospheric CO2 (Rothenberg et al. 2012), at least in part because photosynthesis is enhanced by the increased proportion of diffuse sunlight (Gu et al. 2003, Mercado et al. 2009). Watson (1997) suggests that volcanic dust deposited on the ocean surface may also contribute to CO2 uptake by increasing ocean productivity.
An important question is whether ocean and terrestrial carbon sinks will tend to saturate as human-made CO2 emissions continue. Piao et al. (2008) and Zhao and Running (2010) suggest that there already may be a reduction of terrestrial carbon uptake, while Le Quéré et al. (2007) and Schuster and Watson (2007) find evidence of decreased carbon uptake in the Southern Ocean and North Atlantic Ocean, respectively. However, others (Knorr 2009, Sarmiento et al. 2010, Ballantyne et al. 2012) either cast doubt on the reality of a reduced uptake strength or find evidence for increased uptake.
An informative presentation of CO2 observations is the ratio of annual CO2 increase in the air divided by annual fossil fuel CO2emissions (Keeling et al. 1973), the 'airborne fraction' (Figure 3, right scale). An alternative definition of airborne fraction includes in the denominator of this ratio an estimated net anthropogenic CO2 source from changes in land use, but this latter term is much more uncertain than the two terms involved in the Keeling et al. (1973) definition. For example, analysis by Harris et al. (2012) reveals a range as high as a factor of 2–4 in estimates of recent land use emissions; see also the discussion by Sarmiento et al. (2010). However, note that the airborne fraction becomes smaller when estimated land use emissions are included, with the uptake fraction (one minus airborne fraction) typically greater than 0.5.

Figure 3.
Figure 3. Fossil fuel CO2 emissions (left scale) and airborne fraction, i.e., the ratio of observed atmospheric CO2 increase to fossil fuel CO2 emissions. Final three points are 5-, 3- and 1-year means.
The simple Keeling airborne fraction, clearly, is not increasing (Figure 3). Thus the net ocean plus terrestrial sink for carbon emissions has increased by a factor of 3–4 since 1958, accommodating the emissions increase by that factor.
Remarkably, and we will argue importantly, the airborne fraction has declined since 2000 (Figure 3) during a period without any large volcanic eruptions. The 7-year running mean of the airborne fraction had remained close to 60% up to 2000, except for the period affected by Pinatubo. The airborne fraction is affected by factors other than the efficiency of carbon sinks, most notably by changes in the rate of fossil fuel emissions (Gloor et al. 2010). However, it is the dependence of the airborne fraction on fossil fuel emission rate that makes the post-2000 downturn of the airborne fraction particularly striking. The change of emission rate in 2000 from 1.5%  to 3.1% per year (Figure 1), other things being equal, would have caused a sharp increase of the airborne fraction (the simple reason being that a rapid source increase provides less time for carbon to be moved downward out of the ocean's upper layers).
A decrease in land use emissions during the past decade (Harris et al. 2012) could contribute to the decreasing airborne fraction in Figure 3, although Malhi (2010) presents evidence that tropical forest deforestation and regrowth are approximately in balance, within uncertainties. Land use change can be only a partial explanation for the decrease of the airborne fraction; something more than land use change seems to be occurring.
We suggest that the huge post-2000 increase of uptake by the carbon sinks implied by Figure 3 is related to the simultaneous sharp increase in coal use (Figure 1). Increased coal use occurred primarily in China and India (Boden et al. 2012; BP 2012; see graphs at www.columbia.edu/~mhs119/Emissions/Emis_moreFigs/). Satellite radiance measurements for July–December, months when desert dust does not dominate aerosol amount, yield an increase of aerosol optical depth in East Asia of about 4%/yr during 2000–2006 (van Donkelaar et al. 2008). Associated gaseous and particulate emissions increased rapidly after 2000 in China and India (Lu et al. 2011, Tian et al. 2010). Some decrease of the sulfur component of emissions occurred in China after 2006 as wide application of flue-gas desulfurization began to be initiated (Lu et al. 2010), but this was largely offset by continuing emission increases from India (Lu et al. 2011).
We suggest that the surge of fossil fuel use, mainly coal, since 2000 is a basic cause of the large increase of carbon uptake by the combined terrestrial and ocean carbon sinks. One mechanism by which fossil fuel emissions increase carbon uptake is by fertilizing the biosphere via provision of nutrients essential for tissue building, especially nitrogen, which plays a critical role in controlling net primary productivity and is limited in many ecosystems (Gruber & Galloway 2008). Modeling (e.g., Thornton et al. 2009) and field studies (Magnani et al. 2007) confirm a major role of nitrogen deposition, working in concert with CO2 fertilization, in causing a large increase in net primary productivity of temperate and boreal forests. Sulfate aerosols from coal burning also might increase carbon uptake by increasing the proportion of diffuse insolation, as noted above for Pinatubo aerosols, even though the total solar radiation reaching the surface is reduced.
Thus we see the decreased CO2 airborne fraction since 2000 as sharing some of the same causes as the decreased airborne fraction after the Pinatubo eruption (Figure 3). CO2 fertilization is likely the major effect, as a plausible addition of 5 Tg N per year from fossil fuels and net ecosystem productivity of 200 kg C per kg N (Magnani et al. 2007, 2008) yields an annual carbon drawdown of 1 Gt C per year, which is of the order of what is needed to explain the post-2000 anomaly in airborne CO2. However, an aerosol-induced increase of diffuse radiation might also contribute. Although tropospheric aerosol properties are not accurately monitored, there are suggestions of an upward trend of stratospheric background aerosols since 2000 (Hofmann et al. 2009, Solomon et al. 2011), which could be a consequence of more tropospheric aerosols at low latitudes where injection of tropospheric air into the stratosphere occurs (Holton et al. 1995). We discuss climate implications of the reduced CO2 airborne fraction after presenting data for other greenhouse gases.
Atmospheric CH4 is increasing more slowly than in IPCC scenarios (Figure 4), which were defined more than a decade ago (IPCC 2001). However, after remaining nearly constant for several years, CH4 has increased during the past 5 years, pushing slightly above the level that was envisaged in the Alternative Scenario of Hansen et al. (2000). Reduction of CH4, besides slowdown in CO2 growth in the 21st century and a decline of CO2 in the 22nd century, is a principal requirement to achieve a low climate forcing that stabilizes climate, in part because CH4 also affects tropospheric ozone and stratospheric water vapor. The Alternative Scenario, defined in detail by Hansen and Sato (2004), keeps maximum global warming at ~1.5 °C relative to 1880–1920, under the assumption that fast-feedback climate sensitivity is ~3 °C for doubled CO2 (Hansen et al. 2007). The Alternative Scenario allows CO2 to reach 475 ppm in 2100 before declining slowly; this scenario assumes that reductions of non-CO2 greenhouse gases and black carbon aerosols can be achieved sufficient to balance the warming effect of likely future decreases of reflective aerosols.

Figure 4.
Figure 4. Observed atmospheric CH4 amount and scenarios for the 21st century. Alternative scenario (Hansen et al. 2000, Hansen & Sato 2004) yields maximum global warming ~1.5 °C above 1880–1920. Other scenarios are from IPCC (2001). Forcing on right hand scale is adjusted forcing, Fa, relative to values in 2000 (Hansen et al. 2007).
There are anthropogenic sources of CH4 that potentially could be reduced; indeed, the leveling off of CH4 amount during the past 20 years seems to have been caused by decreased venting in oil fields (Simpson et al. 2012), but the feasibility of overall CH4 reduction also depends on limiting global warming itself, because of the potential for amplifying climate-CH4 feedbacks (Archer et al. 2009, Koven et al. 2011). Furthermore, reduction of atmospheric CH4 might become problematic if unconventional mining of gas, such as 'hydro-fracking', expands widely (Cipolla 2009), as discussed further below.
The growth rate for the total climate forcing by well-mixed greenhouse gases has remained below the peak values reached in the 1970s and early 1980s, has been relatively stable for about 20 years, and is falling below IPCC (2001) scenarios (Figure 5). However, the greenhouse gas forcing is growing faster than in the Alternative Scenario. MPTGs and OTGs in Figure 5 are Montreal Protocol Trace Gases and Other Trace Gases (Hansen & Sato 2004).

Figure 5.
Figure 5. Five-year mean of the growth rate of climate forcing by well-mixed greenhouse gases, an update of Figure 4 of Hansen and Sato (2004). Forcing calculations use equations of Hansen et al. (2000). The moderate uncertainties in radiative calculations affect the scenarios and actual greenhouse gas results equally and thus do not alter the conclusion that the actual forcing falls below that of the IPCC scenarios.
If greenhouse gases were the only climate forcing, we would be tempted to infer from Rahmstorf's conclusion (that actual climate change has exceeded IPCC projections) and our conclusion (that actual greenhouse gas forcings are slightly smaller than IPCC scenarios) that actual climate sensitivity is on the high side of what has generally been assumed. Although that may be a valid inference, the evidence is weakened by the fact that other climate forcings are not negligible in comparison to the greenhouse gases and must be accounted for.
Natural forcings, by changing solar irradiance and volcanic aerosols, are well-measured since the late 1970s and included in most IPCC (2007) climate simulations. The difficulty is human-made aerosols. Aerosols are readily detected in satellite observations, but determination of their climate forcing requires accurate knowledge of changes in aerosol amount, size distribution, absorption and vertical distribution on a global basis—as well as simultaneous data on changes in cloud properties to allow inference of the indirect aerosol forcing via induced cloud changes. Unfortunately, the first satellite mission capable of measuring the needed aerosol characteristics (Aerosol Polarimetry Sensor on the Glory satellite (Mishchenko et al. 2007)) suffered a launch failure, and as yet there are no concrete plans for a replacement mission.
The human-made aerosol climate forcing thus remains uncertain. IPCC (2007) concludes that aerosols are a negative (cooling) forcing, probably between -0.5 and -2.5 W m-2. Hansen et al. (2011), based mainly on analysis of Earth's energy imbalance, derive an aerosol forcing -1.6 ± 0.3 W m-2, consistent with an analysis of Murphy et al. (2009) that suggests an aerosol forcing about -1.5 W m-2 (see discussion in Hansen et al. 2011). This large negative aerosol forcing reduces the net climate forcing of the past century by about half (IPCC 2007; Figure 1 of Hansen et al. 2011). Coincidentally, this leaves net climate forcing comparable to the CO2 forcing alone.
Reduction of the net human-made climate forcing by aerosols has been described as a 'Faustian bargain' (Hansen & Lacis 1990, Hansen 2009), because the aerosols constitute deleterious particulate air pollution. Reduction of the net climate forcing by half will continue only if we allow air pollution to build up to greater and greater amounts. More likely, humanity will demand and achieve a reduction of particulate air pollution, whereupon, because the CO2 from fossil fuel burning remains in the surface climate system for millennia, the 'devil's payment' will be extracted from humanity via increased global warming.
So is the new data we present here good news or bad news, and how does it alter the 'Faustian bargain'? At first glance there seems to be some good news. First, if our interpretation of the data is correct, the surge of fossil fuel emissions, especially from coal burning, along with the increasing atmospheric CO2 level is 'fertilizing' the biosphere, and thus limiting the growth of atmospheric CO2. Also, despite the absence of accurate global aerosol measurements, it seems that the aerosol cooling effect is probably increasing based on evidence of aerosol increases in the Far East and increasing 'background' stratospheric aerosols.
Both effects work to limit global warming and thus help explain why the rate of global warming seems to be less this decade than it has been during the prior quarter century. This data interpretation also helps explain why multiple warnings that some carbon sinks are 'drying up' and could even become carbon sources, e.g., boreal forests infested by pine bark beetles (Kurz et al. 2008) and the Amazon rain forest suffering from drought (Lewis et al. 2011), have not produced an obvious impact on atmospheric CO2.
However, increased CO2 uptake does not necessarily mean that the biosphere is healthier or that the increased carbon uptake will continue indefinitely (Matson et al. 2002, Galloway et al. 2002, Heimann & Reichstein 2008, Gruber & Galloway 2008). Nor does it change the basic facts about the potential magnitude of the fossil fuel carbon source (Figure 6) and the long lifetime of the CO2 in the surface carbon reservoirs (atmosphere, ocean, soil, biosphere) once the fossil fuels are burned (Archer 2005). Fertilization of the biosphere affects the distribution of the fossil fuel carbon among these reservoirs, at least on the short run, but it does not alter the fact that the fossil carbon will remain in these reservoirs for millennia.

Figure 6.
Figure 6. Fossil fuel CO2 emissions and carbon content (1 ppm atmospheric CO2~2.12 GtC). Historical emissions are from Boden et al. (2012). Estimated reserves and potentially recoverable resources are based on energy content values of Energy Information Administration (EIA 2011), German Advisory Council (GAC 2011), and Global Energy Assessment (GEA 2012). We convert energy content to carbon content using emission factors of Table 4.2 of IPCC (2007) for coal, gas, and conventional oil, and, following IPCC, we use an emission factor of unconventional oil the same as that for coal.
Humanity, so far, has burned only a small portion (purple area in Figure 6) of total fossil fuel reserves and resources. Yet deleterious effects of warming are apparent (IPCC 2007), even though only about half of the warming due to gases now in the air has appeared, the remainder still 'in the pipeline' due to the inertia of the climate system (Hansen et al. 2011). Already it seems difficult to avoid passing the 'guardrail' of no more than 2 °C global warming that was agreed in the Copenhagen Accord of the United Nations Framework Convention on Climate Change (UNFCCC 2010). And Hansen et al. (2008), based primarily on paleoclimate data and evidence of deleterious climate impacts already at 385 ppm CO2, concluded that an appropriate initial target for CO2 was 350 ppm, which implied a global temperature limit, relative to 1880–1920 of about 1 °C. What is clear is that most of the remaining fossil fuels must be left in the ground if we are to avoid dangerous human-made interference with climate.
The principal implication of our present analysis probably relates to the Faustian bargain. Increased short-term masking of greenhouse gas warming by fossil fuel particulate and nitrogen pollution represents a 'doubling down' of the Faustian bargain, an increase in the stakes. The more we allow the Faustian debt to build, the more unmanageable the eventual consequences will be. Yet globally there are plans to build more than 1,000 coal-fired power plants (Yang & Cui 2012) and plans to develop some of the dirtiest oil sources on the planet (EIA 2011). These plans should be vigorously resisted. We are already in a deep hole—it is time to stop digging.
http://iopscience.iop.org/1748-9326/8/1/011006
pdf file of original article: http://iopscience.iop.org/1748-9326/8/1/011006/pdf/1748-9326_8_1_011006.pdf
Read More
Posted in Aerosols, Atmospheric CO2, Big Oil Big Coal, Carbon sinks, dust, ENSO, fracking, James Hansen, Pinatubo rebound effect, radiative forcing, Stefan Rahmstorf | No comments
Older Posts Home
Subscribe to: Posts (Atom)

Popular Posts

  • James Hansen: Tar Sands and Dirty Tricks
    by James Hansen, September 13, 2013 The New Yorker just published (16 September issue) an excellent article "The President and the Pip...
  • Andrew Glikson: Another link between CO2 and mass extinctions of species
    by Andrew Glikson , The Conversation , March 22, 2013 It’s long been known that massive increases in emission of CO 2 from volcanoes, assoc...
  • Bombshell: Recent Warming Is ‘Amazing And Atypical’ And Poised To Destroy Stable Climate That Enabled Civilization
    by Joe Romm , Climate Progress , March 8, 2013 New Science Study Confirms ‘Hockey Stick’: The Rate Of Warming Since 1900 Is 50 Times Greater...
  • Real Pragmatism for Real Climate Change: Interview with Dr. John Abraham
    by John Stafford, OilPrice.com, March 26, 2013 At a time when extreme weather incidents are causing billions in damages, businesses, governm...
  • Exxon acting like national guard under martial law in Mayflower, Arkansas, Pegasus tar sands dilbit spill cleanup
    Arkansas town in lockdown after oil spill nightmare by  Suzi Parker , Grist, April 5, 2013 REUTERS / Jacob Slaton There’s one Exxon gas stat...
  • James Hansen interview (video) of why he retired from NASA to be more active in climate actions
    by Climate Science Watch, April 12, 2013 Sustainability Media Lab shot this video interview on April 10, 2013, with James Hansen on why he l...
  • Steve Horn: State Dept Keystone XL Enironmental Reviewer Claimed Delaware Tar Sands Refinery Made Air Cleaner
    by Steve Horn, DeSmogBlog, July 18, 2013 A  DeSmogBlog  investigation reveals  Environmental Resources Management, Inc. (ERM Group) , the co...
  • Steve Horn: State Department's out-sourced Keystone XL environmental impact evaluation performed without knowing pipeline's route!!!
    by Steve Horn, DeSmogBlog, July 8, 2013 The State Department's decision to hand over control to the oil industry to evaluate its own ...
  • "A Reconstruction of Regional and Global Temperature for the Past 11,300 Years," by S. A. Marcott et al., Science, 339 (2013); doi: 10.1126/science.1228026
    Science  (8 March 2013),  Vol. 339, N o. 6124,  pp. 1198-1201  DOI:  10.1126/science.1228026 REPORT A Reconstruction of Regional and Global ...
  • Steve Horn: The Flip Side of Obama’s Keystone XL Delay
    Even as President Obama cast a veneer of caution over the Keystone pipeline’s northern half, he quietly expedited dozens of similar projec...

Categories

  • 2012 temperatures (3)
  • 2013 temperatures (6)
  • acidizing (1)
  • Adam Siegel (1)
  • Adaptation (1)
  • Aerosols (7)
  • Africa (2)
  • Al Gore (1)
  • Alaska (6)
  • albedo (2)
  • albedo flip (5)
  • ALEC (8)
  • Alun Hubbard (2)
  • Amazon rainforest (1)
  • Andrew C. Revkin (2)
  • Andrew Freedman (1)
  • Andrew Glikson (1)
  • Andrew J. Weaver (1)
  • Antarctic bottom water (2)
  • Antarctic Circumpolar Winds (1)
  • Antarctic Ice Sheet -- Western (WAIS) (4)
  • Antarctic Oscillation - AAO (1)
  • Antarctic warming (1)
  • Anthony R Ingraffea (1)
  • Anthony Watts (1)
  • Arctic amplification (7)
  • Arctic melt season (1)
  • Arctic Methane Emergency Group (7)
  • Arctic Ocean (5)
  • Arctic Oscillation (5)
  • Arctic sea ice mean speed (4)
  • Arctic sea ice volume (24)
  • Argo (1)
  • Atlantic Meridional Overturning Circulation - AMOC (2)
  • Atmospheric CO2 (8)
  • Australia (6)
  • Barry Bickmore (1)
  • bees (9)
  • Benjamin Santer (4)
  • Bidder 70 (1)
  • Big Oil Big Coal (89)
  • Bill McKibben (11)
  • Black carbon (2)
  • BOEMRE (2)
  • Brad Johnson (1)
  • Brazil (2)
  • Brian Eister (2)
  • Canada (24)
  • Carbon sinks (2)
  • Catastrophic climate change (1)
  • Charles Monnett (3)
  • China (15)
  • Chris Mooney (1)
  • Civil resistance (33)
  • Climate Change Criminals (24)
  • Climate Denial Machine (47)
  • Climate modelling (5)
  • Climate Patriots (2)
  • Climate sensitivity (1)
  • CO2 draw-down (1)
  • Consequences to infrastructure (1)
  • contrails (1)
  • coral reefs (1)
  • Corexit (1)
  • corrupt officials (60)
  • Coupled ice-ocean model (3)
  • Coupled ocean–atmosphere model (2)
  • crop yields (9)
  • CRU e-mails (2)
  • CryoSat-2 (1)
  • cyclones (2)
  • Dana Nuccitelli (9)
  • Dansgaard–Oeschger event (1)
  • David Roberts (2)
  • David Spratt (2)
  • Deforestation (2)
  • deglaciation (1)
  • Denial psychology (9)
  • divestment (11)
  • Donors Trust (2)
  • Drought (9)
  • dust (1)
  • earthquakes (3)
  • East Siberian Arctic Shelf (1)
  • Eastern Siberian Arctic Shelf -- ESAS (2)
  • Eemian (3)
  • Eli Rabett (5)
  • Elizabeth Kolbert (1)
  • Ellesmere (1)
  • ENSO (11)
  • Eric Rignot (1)
  • Extreme weather events (15)
  • Ferrel cells (1)
  • First Nations (9)
  • Flooding (7)
  • floods (1)
  • Forest fires (3)
  • fracking (47)
  • Fred Singer (1)
  • freshwater lens (1)
  • fugitive emissions (2)
  • Gareth Renowden (2)
  • Gavin Schmidt (3)
  • Geoengineering (1)
  • George Monbiot (2)
  • Gerald Meehl (2)
  • glacial runoff (1)
  • Global dimming (1)
  • glyphosate (1)
  • Graham Readfearn (9)
  • Greenland ice melt (21)
  • Greenpeace (3)
  • Greg Laden (3)
  • GrIS (9)
  • Hadley cells (2)
  • Hadley circulation (2)
  • Hans Joachim Schellnhuber (1)
  • Harrison Loony Tool Schmitt (1)
  • Heartland Institute (14)
  • heat dome (3)
  • Heat waves (13)
  • hockey stick (10)
  • Holocene thermal maximum (2)
  • hurricanes (1)
  • IceSat (2)
  • Igor Semiletov (4)
  • Inhofe (2)
  • Insurers (2)
  • Intertropical Convergence Zone - ICZ (2)
  • Jakobshavn Isbræ (1)
  • James Hansen (15)
  • Jason Box (10)
  • Jeff Masters (6)
  • Jennifer Francis (7)
  • Jeremy Grantham (1)
  • Jet stream (4)
  • John Abraham (15)
  • John Christy (1)
  • John Cook (2)
  • John Kerry (2)
  • Joseph Romm (12)
  • Josh Willis (2)
  • Judith Curry (1)
  • Julie Brigham-Grette (1)
  • Justin Gillis (3)
  • Katharine Hayhoe (2)
  • Kerry Emanuel (2)
  • Kevin Grandia (1)
  • Kevin Trenberth (14)
  • Keystone Principle (14)
  • Keystone XL (57)
  • Koch Industries (13)
  • Konrad Steffen (2)
  • Lake El'gygytgyn (1)
  • Leo Hickman (2)
  • Marc Morano (3)
  • Mark Boslough (1)
  • Mark Hertsgaard (1)
  • Mark Serreze (1)
  • Mass extinctions (1)
  • Mauri Pelto (1)
  • Medieval Climate Anomaly (2)
  • Meridonal heat transport - MHT (1)
  • Methane (2)
  • Methane Gun hypothesis (9)
  • Methane hydrates (11)
  • Michael Mann (20)
  • Michael Oppenheimer (2)
  • Michael Tobis (2)
  • Milne Ice Shelf (1)
  • Mitigation (1)
  • Monckton (6)
  • Monsanto (3)
  • Myles Allen (1)
  • Naomi Klein (1)
  • Natalia Shakhova (4)
  • national security (3)
  • Neela Banerjee (1)
  • neonicotinoid pesticide (9)
  • Nitrous oxide (1)
  • North Atlantic meridional overturning circulation (1)
  • North Atlantic Oscillation (2)
  • Obama (1)
  • OccupyWallStreet (5)
  • ocean acidification (2)
  • Ocean chemistry (1)
  • ocean heat content (15)
  • Ocean salinity (2)
  • Ocean temperatures (4)
  • ozone levels (1)
  • paleo-climate (4)
  • Paleo-CO2 (2)
  • Patrick Michaels (1)
  • Paul Douglas (1)
  • PDO - Pacific Decadal Oscillation (4)
  • Peak food (10)
  • Peak oil (1)
  • Peak Water (3)
  • Permafrost (1)
  • Permafrost - subsea (2)
  • Permian mass extinction (1)
  • Peter Gleick (3)
  • Peter Sinclair (13)
  • Peter Wadhams (4)
  • Petermann Glacier (1)
  • Phil Jones (1)
  • Pinatubo rebound effect (2)
  • pine beetles (1)
  • Pine Island Glacier (1)
  • PIOMAS (3)
  • polar bears (5)
  • Polar jet stream (8)
  • Polar vortex (2)
  • Positive feedbacks (1)
  • Precipitation extremes (4)
  • radiative forcing (2)
  • Ray Weymann (1)
  • Raypierre (1)
  • resilience (1)
  • resource scarcity (3)
  • Richard Alley (3)
  • Richard Somerville (1)
  • Rick Piltz (2)
  • Robert Corell (1)
  • Roger Pielke Jr. (1)
  • Rossby waves (2)
  • Russia (1)
  • saltwater intrusion (1)
  • Scott Mandia (1)
  • Sea level rise (13)
  • sea surface temperature anomalies (1)
  • Sediment cores (2)
  • Shell Oil (4)
  • snow cover (3)
  • Snowden (1)
  • Solar activity (1)
  • solar radiation (1)
  • Soot (3)
  • Stefan Rahmstorf (5)
  • Steve Horn (13)
  • Storm intensity (1)
  • Storm tracks diverted polewards (1)
  • Stratospheric Sudden Warmings (3)
  • sulfoxaflor (1)
  • Tamino (1)
  • tar sands (57)
  • Ted Scambos (1)
  • Terracide (1)
  • These people are completely insane (7)
  • Thomas L. Friedman (2)
  • threat multiplier (1)
  • Threat to our democracy (49)
  • Tim DeChristopher (1)
  • Tipping elements (1)
  • Tom Steyer (1)
  • Tornado statistics (2)
  • TransCanada (3)
  • trees (1)
  • tropospheric water vapor (1)
  • Typhoon Yasi (1)
  • Van Jones (2)
  • volcanism (1)
  • WAIS (1)
  • Waleed Abdalati (1)
  • Walker circulation (2)
  • Walt Meier (1)
  • Water shortage (2)
  • William Krabill (1)
  • Willie Soon (1)
  • Wind pattern changes (2)
  • Wind power (2)

Blog Archive

  • ▼  2013 (500)
    • ▼  September (27)
      • James Hansen: Tar Sands and Dirty Tricks
      • Summer 2013 weather extremes tied to extraordinari...
      • Court rulings show judges accept climate science
      • DC judge denies another effort to derail Michael M...
      • Scientist Michael Mann named in top 10 influential...
      • Justin Gillis, NYT: A Climate Alarm, Too Muted for...
      • Top Obama aide Heather Zichal worked the Pavillion...
      • Call Sacramento. Vote NO on SB4
      • Graham Readfearn: The undiscerning climate bookshelf
      • Graham Readfearn: Australia's Department of Defenc...
      • Top Occupy Wall Street Cartoons
      • URGENT: phone your CA rep to prevent industry amen...
      • Tom Steyer, NexGen: Keystone XL bad economics for ...
      • Daily Mail Lies! No 60% recovery in Arctic sea ice...
      • Steve Horn: The Flip Side of Obama’s Keystone XL D...
      • Joseph E. Stiglizt, NYT: Why Janet Yellen, Not Lar...
      • "Global crop exposure to critical high temperature...
      • Naomi Klein: Green groups may be more damaging th...
      • Margaret Heffernan: Dare to Disagree
      • "Spring snow cover extent reductions in the 2008-2...
      • U.S. Becomes Largest Wood Pellet Exporter,Enviva, ...
      • Rebuttal to Michael Tobis' unsubstantiated attacks...
      • Why trust climate models? It’s a matter of simple ...
      • Steve Horn: "Frackademia" By Law: Section 999 of t...
      • MUST SEE, Peter Sinclair: No Slowdown in Global Wa...
      • Dana Nuccitelli: The Pacific Ocean fills in anothe...
      • Posts from August 2013
    • ►  August (78)
    • ►  July (74)
    • ►  June (56)
    • ►  May (62)
    • ►  April (105)
    • ►  March (98)
Powered by Blogger.

About Me

Unknown
View my complete profile