TheNextGeneration

  • Subscribe to our RSS feed.
  • Twitter
  • StumbleUpon
  • Reddit
  • Facebook
  • Digg
Showing posts with label Greenland ice melt. Show all posts

Friday, August 30, 2013

Greenland's subterranean mega-canyon flows to the Petermann Glacier

Posted on 7:24 AM by Unknown
by Brian Kahn, Climate Central, August 29, 2013

Researchers have found a "mega canyon" in Greenland tucked under a mile and a half of ice that could rival the size and depth of Arizona’s Grand Canyon. While the discovery won’t become a major tourist attraction, it does provide insight into how meltwater courses its way underneath the world’s second-largest ice sheet, and how that might affect ice shelves and glaciers at its periphery. Melting ice from Greenland and Antarctica is now the dominant contributor to global sea level rise, which is expected to accelerate in coming decades.

The bedrock that Greenland’s ice sheet sits on has generally been thought to be flat. However, the new discovery, laid out in the latest issue of the journal Science, shows it may be far more complex than previously thought. 

“There was a hint something was there, but this gives us rich imagery,” said Robin Bell, who heads the polar geophysics group at Columbia's Lamont-Doherty Earth Observatory, and was not associated with the study.

 
A three dimensional view of the subglacial canyon looking northeast. Researchers used NASA IceBridge data to visualize the canyon buried under a mile and a half of ice. Credit: Jonathan Bamber/Bristol University. 
 
Using data from NASA’s Operation IceBridge, which uses a special type of radar to peer underneath the ice's surface, the new research found a canyon that stretches for at least 465 miles from Greenland’s interior to its northwest coast. Parts of the canyon are a half mile deep and over 6 miles wide. In comparison, the Grand Canyon is 277 miles long and at its deepest point is over a mile deep and 18 miles wide. 

The researchers who found it have dubbed it a “paleofluvial megacanyon,” indicating that it was formed by a river well before Greenland’s ice sheet covered it up some 3.5 million years ago.
 
But the canyon is more than just an awe-inspiring discovery. According to Jonathan Bamber, professor of physical geography at Bristol University, U.K., the canyon effectively funnels water from Greenland’s interior to the ocean. He stressed that the melting processes under the ice have little connection with climate change.
 
However, as it nears the periphery, that water can affect the periphery of the ice sheet, particularly the shelves that stretch out into the ocean. There, ice has been slipping into the ocean and melting faster in recent decades.
 
One dramatic example is the Petermann ice shelf, which sits near the mouth of the canyon. The ice shelf made headlines in 2010 when it shed an iceberg four times the size of Manhattan and again in 2012 when it shed another iceberg half that size.
 
In 2008, researchers found channels in the bottom of the Petermann ice shelf, which weakened the ice and turned out to be harbingers of the events to come. Their findings suggested that warmer ocean water caused the channels. However, the new study suggests the mega canyon may be playing a role here as well.
 
“We argue that an important contribution to these undershelf channels is that there’s a large amount of subglacial channels,” Bamber said.
 
Bell likened the process to beating eggs, where the water flowing down the canyon acts as a “whisk,” mixing up warmer ocean water under the ice shelf and deepening the cavities more rapidly.
 
Increased ice melt from this, as well as other surface melting due to increasing air temperatures could make Greenland a major contributor to sea level rise by the end of the 21st century. The melting of Greenland’s glaciers has also added a large boost of freshwater to the North Atlantic which could alter ocean currents and the ocean’s ability to take up carbon dioxide.
 
Related Content  Greenland Sheds a ‘Mega-Berg’ Arctic Wildfires Speed Melting of Greenland's Ice: Study Greenland Glacier Sheds Two Manhattans' Worth of Ice Widespread Greenland Melting a Sign of Things to Come

http://www.climatecentral.org/news/newly-discovered-greenland-mega-canyon-sends-water-to-the-sea-16415
Read More
Posted in Greenland ice melt, GrIS, Petermann Glacier, Sea level rise | No comments

Monday, August 26, 2013

Hudson shoreline faces threat from Greenland thaw and sea level rise

Posted on 9:07 AM by Unknown
An icy warning for the Hudson Valley
An icy warning for the Hudson Valley: Greenland's ice sheets are melting at record paces, meaning higher sea-levels and higher tides and storm surges in the Hudson River Valley.

by John Ferro, Poughkeepsie Journal, August 25, 2013

After Tropical Storm Irene brought 4 feet of Hudson River water into the Beacon Sloop Club two years ago, its members made sure the damage would be less next time. 

The members of the club, which offers free sails on the sloop Woody Guthrie and sponsors annual strawberry and corn festivals, replaced ruined Sheetrock with exterior-grade siding.

“So when it flooded,” longtime club member Tom LaBarr said, “we wouldn’t have to replace it. And sure enough, last year it flooded again” during Superstorm Sandy.

Up and down the Hudson River, and along Long Island and the New Jersey shoreline, many communities are preparing for one of the most consistent trends reflecting the world’s changing climate: sea-level rise. The impacts range from higher tides that may inundate some riverfront areas of the Hudson, to more devastating storm surges.

More than 9,000 acres in the Hudson River Valley and as many as 3,600 households could be inundated by 2100 just at high tide, if global sea levels rise by as much as 6 feet, according to a recent report from Poughkeepsie-based nonprofit Scenic Hudson.

“Every waterfront community in the Hudson Valley has to be planning for sea-level rise and more violent storms,” Judith Enck, the Environmental Protection Agency’s local administrator, said during a visit to Poughkeepsie this month. “And that affects land-use decisions — where we put things, how close to the water and whether or not we want buffers.”

In Rockland County, scientists at Lamont-Doherty Earth Observatory returned recently from a trip to Greenland, where they continued testing the IcePod. The device contains infrared, laser, radar and photographic sensors that will provide greater insight into the biggest driver of sea-level rise: the melting of on-land ice.

“Any time we talk about the status of the ice sheets in Antarctica and Greenland, we talk about the concern of sea-level rise,” said Peter West, spokesman for the National Science Foundation’s Division of Polar Programs, which contributed $4.1 million to the five-year IcePod project.

When the National Oceanic and Atmospheric Administration issued its annual State of the Climate report Aug. 6, two facts were striking.

One, total sea level rose to a globally averaged record high last year at 1.4 inches above the 1993-2010 long-term average.

“That trend hasn’t ended at all,” Jessica Blunden, a scientist with NOAA’s National Climatic Data Center, said during a teleconference to announce the report’s findings. “We are still seeing continued increases in sea-level rise, and we are at record levels right now.”

And second, ice melt — primarily in Greenland and Antarctica — is contributing more than twice as much to global sea-level rise compared with warming waters, which expand as the temperature rises.

The potential impacts of ice melt are vast.

One-quarter of the world’s population resides within 60 miles distance and 300 feet elevation of the coastline, according to the Intergovernmental Panel on Climate Change.

More than 8 million people in the United States live in areas at risk of coastal flooding, according to NOAA.

More than 60% of New Yorkers live in homes that stand to be affected by future sea-level rise, according to a 2010 report prepared by the state Legislature’s Sea Level Rise Task Force.

The problem: Because conditions are changing so quickly, and so much about the complex interactions among weather, ice and ocean dynamics still need to be understood, scientists cannot say with certainty whether things will be better than expected – or much worse.

“Many of the planning models used in infrastructure planning rely on a set of assumptions that essentially count on the future being statistically a lot like the past,” NOAA Acting Administrator Kathryn Sullivan said during the agency’s teleconference. “Trends like the ones we have seen in the data certainly should lead one to question whether that will be so.”

Preliminary data suggest that 2012 will be the 22nd consecutive year the total mass of the world’s glaciers declined.

The Greenland ice sheet extends about 656,000 square miles, a little less than a quarter of the size of the continental United States. In some places it is more than two miles thick, its weight compressing the bedrock below.

Far larger is the Antarctic ice sheet, which is 5.4 million square miles, about 1.5 times the size of the lower 48 states.

Greenland’s ice sheet contains enough frozen freshwater that if it all melted — the chances of which are remote — sea levels would rise about 20 feet, according to the National Snow and Ice Data Center. Antarctica’s ice sheet has enough frozen water to raise sea levels by 200 feet.

The mass of Greenland’s ice sheet has been declining, NOAA’s records show. From 1979 to 2006, summer melt on the ice sheet increased 30 percent. In 2012, it reached a record, with 97 percent of the surface experiencing some melting for a two-day period in July. And though the glaciers recover ice in the winter months, the winter gains have not offset the losses in summer.

The ice’s behavior correlates with other changes. Drastic and persistent reduction in the extent of the summer sea-ice cover around the coasts of places like Greenland can be linked directly to the warming of ocean surface temperatures in those open areas, said Jackie Richter-Menge, a researcher with the U.S. Army Corps of Engineers’ Cold Regions Research and Engineering Laboratory.

In turn, the warmer oceans can be linked directly to increases in tundra vegetation and the productivity of aquatic life in the coastal regions.

The reason these linkages are important, Richter-Menge said, is they reflect the persistence in the changes scientists are observing in the Arctic.

“In the Arctic, the records or near-records being reported from year to year are no longer anomalies or exceptions,” Richter-Menge said. “Really, they have become the norm that we see in the Arctic and what we expect to see for the foreseeable future.”

Likewise, scientists think reduced ice levels are being driven by a number of factors, not just warmer temperatures.

Satellite data show the surface reflectivity of the Greenland ice sheet in the warm-weather months has decreased. In other words, the ice is getting darker and absorbing more sunlight.

One reason may be as simple as more meltwater absorbs more light. But some theories suggest small bits of ash from western wildfires are making their way to Greenland’s ice sheet. These dark flecks of material may contribute more directly to the loss of reflectivity.

Another force that may be accelerating ice loss lies underneath, unseen and largely unstudied. Glaciers emerging from the ice sheets appear to be flowing more quickly.

“We don’t know if that is because the ocean is warming the edges, or if there is water getting underneath and making the ice flow faster,” said Robin Bell, the lead scientist on Lamont-Doherty’s IcePod project.

Indeed, Bell admits much remains to be understood.

“We don’t really understand all the processes,” Bell said, “and that is why we have been working hard to put this instrumentation suite together. Satellites let us look from a long distance. But to understand the processes, we need to get up close and personal with the ice sheet.”

Asked whether she worries about the future, Bell said she does not. Nonetheless, challenges remain.

“Change is always scary,” she said. “Humans don’t like change. But change fosters innovation. A lot of the science we see happening is innovation. And there is going to be interesting, innovative engineering and social solutions. Really, it’s about us moving past being afraid and saying, ‘OK, what can we do?’ ”

http://www.poughkeepsiejournal.com/article/20130825/NEWS04/308250059/Melting-ice-Hudson-shoreline-faces-threat-from-Greenland-thaw
Read More
Posted in Greenland ice melt, Sea level rise | No comments

Thursday, August 1, 2013

Maniitsoq, Greenland, at nearly 80 F, its highest temperature ever recorded

Posted on 1:28 PM by Unknown
by Jason Samenow, Capitol Weather Gang, Washington Post, August 1, 2013

The Danish Meteorological Institute is reporting that on Tuesday, July 30, the mercury rose to 25.9 C (78.6 F) at a station in Greenland, the highest temperature measured in the Arctic country since records began in 1958.

The balmy reading was logged at the observing station Maniitsoq / Sugar Loaf, which is on Greenland’s southwest coast, the DMI reports. It exceeded the 25.5 C (77.9 F) reading taken at  Kangerlussuaq on July 27, 1990, in the same general area. Mantiitsoq is Greenland’s sixth-largest town, with a 2010 population of 2,784.

4880007af6
Weather pattern responsible for record warmth in southwest Greenland (Danish Meteorological Institute)

The DMI says the record warmth was brought about by southeasterly winds, funneled by the flow between a large area of high pressure over continental Greenland, and low pressure over Baffin Island to the west.

It adds the warmth may have been enhanced by a phenomenon known as the Foehn Effect, in which air flows over nearby elevated terrain and compresses and heats on its way down. In this case, DMI believes the air may have passed over the elevated Sugar Loaf ice cap and then dried and warmed up as it descended (or downsloped) on its leeward side into Maniitsoq.

Via the Danish Meteorological Institute: "Satellite photo of the area around Maniitsoq and Sugar Loaf Mountain on Tuesday 30 July 2013. Photo from NASA's Terra satellite."
Via the Danish Meteorological Institute: “Satellite photo of the area around Maniitsoq and Sugar Loaf Mountain on Tuesday 30 July 2013. Photo from NASA’s Terra satellite.”

(IPCC)
Conceptual model of how a warming baseline climate increases the chance of record-breaking weather (IPCC)

The DMI says the warmth was not “unnatural,” but explains it fits into a long-term pattern of climate warming.

“[T]here is an indisputable gradual increase in temperature in Greenland,” DMI writes. “Along the way, any ‘warm event’ thus have a higher probability of being slightly warmer than the previous one.”

Related, from 2012: Greenland ice sheet surface melt: massive meltdown or meaningless trickle?

This warm temperature extreme in Greenland comes on the heels of an astonishing heat wave in northern Siberia.

Wunderground weather historian Christopher Burt described a “perhaps unprecedented” streak of 10 days in the central Arctic region of Russia in which temperatures exceeded 86 degrees F (30 C) in mid-to-late July.

Prior to this, it was the desert southwest reaching heat milestones.  Recall Death Valley set the record for hottest U.S. temperature ever recorded in June, climbing to a blistering 129 degrees.

At the moment, China is in the midst of a record-breaking heat wave.  And in Alaska, Fairbanks and Anchorage have ongoing historically long streaks of warm weather.

These heat events were all likely set up predominantly by the configuration of naturally varying weather patterns. [Yeah, right.]  But  elevated greenhouse gas concentrations may well be tacking on a small [yeah, right] warming contribution, nudging these extreme events into record territory.

http://www.washingtonpost.com/blogs/capital-weather-gang/wp/2013/08/01/greenland-soars-to-highest-temperature-ever-recorded/
Read More
Posted in 2013 temperatures, Greenland ice melt, GrIS | No comments

Wednesday, July 31, 2013

Alun Hubbard and Jason Box: Greenland ice sheet research -- expedition aboard sailing vessel Gambo

Posted on 8:44 AM by Unknown
This is a great video from 2009, still completely relevant:

http://vimeo.com/22626746

Read More
Posted in Alun Hubbard, Greenland ice melt, GrIS, Jason Box | No comments

Monday, July 29, 2013

Alun Hubbard, glaciologist: Greenland's ice sheet is deglaciating

Posted on 4:26 PM by Unknown
by Peter Sinclair, It's Not Cool, July 29, 2013


Latest video for The Yale Forum on Climate Change & the Media, the first since returning from Greenland – includes interviews with ice expert Alun Hubbard, whom I met in Kangerlussuaq, as well as a snip from Richard Alley, at June’s Chapman conference in Granby, CO, and Jason Box, who spoke from our DarkSnowProject HQ in Sisimiut, in early July.

Takeaway – Greenland represents 22 feet of sea level rise, it’s moving faster than anyone thought it could just a few years ago, and there are processes occurring deep in the ice that may make even faster inevitable. According to Hubbard, we may we witnessing the deglaciation of a major ice sheet, with serious global implications.

http://climatecrocks.com/2013/07/29/new-video-greenland-starting-to-slip/
Read More
Posted in Alun Hubbard, Greenland ice melt, GrIS, Jason Box, Peter Sinclair, Richard Alley | No comments

Saturday, July 27, 2013

Supra-glacial lakes flowing into moulins release latent heat, softening the Greenland Ice Sheet up like butter

Posted on 12:56 PM by Unknown
Like butter: Study explains surprising acceleration of Greenland’s inland ice

Like butter: Study explains surprising acceleration of Greenland’s inland ice

NOAA, July 16, 2013
The following news release was provided by the Cooperative Institute for Research in Environmental Sciences, a joint institute of NOAA and the University of Colorado Boulder. For more information, contact Katy Human, kathleen.human@colorado.edu, 303-735-0196.
Surface meltwater draining through cracks in an ice sheet can warm the sheet from the inside, softening the ice and letting it flow faster, according to a new study by scientists at the Cooperative Institute for Research in Environmental Sciences (CIRES) at the University of Colorado Boulder.
During the last decade, researchers have captured compelling evidence of accelerating ice flow at terminal regions, or “snouts,” of Greenland glaciers as they flow into the ocean along the western coast. Now, the new CIRES research shows that the interior regions are also flowing much faster than they were in the winter of 2000-2001, and the paper proposes a reason for the speedup.
Melt on surface of Greeland's Avannarleq Glacier
Melt on surface of Greeland's Avannarleq Glacier. Meltwater from the surface of the Sermeq Avannarleq Glacier drains down toward interior ice. This photograph depicts a region about 10 miles from the ice sheet margin in Southwest Greenland. (Credit: William Colgen, CIRES)
“Through satellite observations, we determined that an inland region of the Sermeq Avannarleq Glacier, 40 to 60 miles from the coastis flowing about 1.5 times faster than it was about a decade ago,” said Thomas Phillips, lead author of the new paper and a CIRES research associate at the time of the study. In 2000-2001, the inland segment was flowing at about 130 feet (40 meters) per year; in 2007-2008, that speed was closer to 200 feet per year (60 m).
“At first, we couldn’t explain this rapid interior acceleration,” Phillips said. “We knew it wasn’t related to what was going on at the glacier’s terminus. The speedup had to be due to changes within the ice itself.”
To shed light on the observed acceleration, Phillips and his team developed a new model to investigate the effects of meltwater on the ice sheet’s physical properties. The team found that meltwater warms the ice sheet, which then—like a warm stick of butter—softens, deforms, and flows faster.
Previous studies estimated that it would take centuries to millennia for new climates to increase the temperature deep within ice sheets. But when the influence of meltwater is considered, warming can occur within decades and, thus, produce rapid accelerations. The paper has been accepted for publication in the Journal of Geophysical Research: Earth Surface, a journal of the American Geophysical Union.
The CIRES researchers were tipped off to this mechanism by the massive amount of meltwater they observed on the ice sheet’s surface during their summer field campaigns, and they wondered if it was affecting the ice sheet. During the last several decades, atmospheric warming above the Greenland Ice Sheet has caused an expanding area of the surface to melt during the summer, creating pools of water that gush down cracks in the ice. The meltwater eventually funnels to the interior and bed of the ice sheet.
Graph of ice sheet velocity, between 2005-2007
Graph of ice sheet velocity, between 2005-2007. A new study explains recent, satellite-observed acceleration of an interior region of the southwestern Greenland Ice Sheet. In this map, reds and yellows indicate areas where ice sheet velocity increased substantially between 2005 and 2007. (Credit: CIRES & AGU)
As the meltwater drains through the ice, it carries with it heat from the sun.
“The sun melts ice into water at the surface, and that water then flows into the ice sheet carrying a tremendous amount of latent energy,” said William Colgan, a coauthor and CIRES adjunct research associate. “The latent energy then heats the ice.”
The new model shows that this speeds up ice flow in two major ways: One, the retained meltwater warms the bed of the ice sheet and preconditions it to accommodate a basal water layer, making it easier for the ice sheet to slide by lubrication. Two, warmer ice is also softer (less viscous), which makes it flow more readily.
“Basically, the gravitational force driving the ice sheet flow hasn’t changed over time, but with the ice sheet becoming warmer and softer, that same gravitational force now makes the ice flow faster,” Colgan said.
This transformation from stiff to soft only requires a little bit of extra heat from meltwater. “The model shows that a slight warming of the ice near the ice sheet bed—only a couple of degrees Celsius—is sufficient to explain the widespread acceleration,” Colgan said.
The findings have important ramifications for ice sheets and glaciers everywhere. “It could imply that ice sheets can discharge ice into the ocean far more rapidly than currently estimated,” Phillips said. “It also means that the glaciers are not finished accelerating and may continue to accelerate for a while. As the area experiencing melt expands inland, the acceleration may be observed farther inland.”
The new model will help scientists more accurately forecast these impacts, and it is being incorporated into Earth-system models for predicting future ice discharge from the Greenland Ice Sheet.
“Traditionally, latent energy has been considered a relatively unimportant factor, but most glaciers are now receiving far more meltwater than they used to and are increasing in temperature faster than previously imagined,” Colgan said. “The chunk of butter known as the Greenland Ice Sheet may be softening a lot faster than we previously thought possible.”
The study was funded through a NASA ROSES grant, NASA’s Greenland Climate Network, and the National Science Foundation. Other coauthors on the paper were CIRES Director Waleed Abdalati, former CIRES Director Konrad Steffen, and CU-Boulder Engineering Professor Harihar Rajaram.
http://research.noaa.gov/News/NewsArchive/LatestNews/TabId/684/ArtMID/1768/ArticleID/10186/Like-butter-Study-explains-surprising-acceleration-of-Greenland%E2%80%99s-inland-ice.aspx
Read More
Posted in Greenland ice melt, GrIS, Konrad Steffen, Sea level rise, Waleed Abdalati | No comments

Greenland surface melt area nearly 50%, July 26, 2013

Posted on 12:47 PM by Unknown


Read More
Posted in Greenland ice melt, GrIS | No comments

Sunday, July 14, 2013

DMI's Surface Mass Budget of the Greenland Ice Sheet

Posted on 8:50 AM by Unknown
The link to this site will go up in the left-hand column of this blog, for our convenience.

Current Surface Mass Budget of the Greenland Ice Sheet

Here you can follow the daily surface mass balance on the Greenland Ice Sheet. The snow and ice model from one of DMI’s climate models is driven every six hours with snowfall, sunlight and other parameters from a research weather model for Greenland, Hirlam-Newsnow. We can thereby calculate the melting energy, refreezing of melt water and sublimation (snow that evaporates without melting first). The result of this is a change in the snow and ice from one day to the next and this change is shown below. All numbers are in water equivalent, that is, the amount of water the snow and ice would correspond to if it was melted.

Left: Map of the surface mass balance today (in mm water equivalent per day). Right: The average surface mass balance for today’s calendar date over the period 1990-2011.

In the above figure, we show the daily surface mass balance (on the left) and you can see where it has snowed and melted (incl. sublimate) on the ice sheet over the last 24 hours. For comparison, the map to the right shows the average value for the same calendar date over the period 1990-2011. This historical average is based on weather from a somewhat different model and the two are therefore not always strictly comparable.
 
The surface mass balance is calculated over a year from September 1st to August 31st (the end of the melt season). The figure to the right shows the sum of all the daily changes from September 1st up to today. Next year on September 1st the map will be reset and we start over. This accumulated map illustrates how much the surface mass balance has contributed in each point across the ice sheet. 

The figure below shows the total daily contribution from all points on the ice sheet (top) and the same accumulated from September 1st to now (bottom). The blue curves show this season’s surface mass balance in gigatons (Gt: 1 Gt is one billion tons and corresponds to 1 cubic kilometer of water), and for comparison the mean curves from the historical model run are shown with two standard deviations on either side. Note that the accumulated curve does not end at 0 at the end of the year. Over the year, it snows more than it melts, but calving of icebergs also adds to the total mass budget of the ice sheet. Satellite observations over the last decade show that the ice sheet is not in balance. The calving loss is greater than the gain from surface mass balance, and Greenland is losing mass at the rate of about 200 Gt/yr.


Map of the accumulated surface mass balance (in mm water equivalent) from September 1st to now.


Top: The total daily contribution to the surface mass balance from the entire ice sheet (blue line, Gt/day). Bottom: The accumulated surface mass balance from September 1st to now (blue line, Gt). The dark grey line shows the corresponding average number from the climatology along with two standard deviations on each side (light grey). In the bottom panel, we also show the season 2011-12 (red) which had very high summer melt in Greenland.
 
Ice flow
Due to gravity, ice flows slowly outwards like dough on a kitchen counter. When snow falls on top of the ice sheet year after year, the layers below are slowly compressed into ice. In the central part of the ice sheet, where little if any melt occurs, new layers will therefore continually be added. The ice does not grow in height, however, since the extra ice is balanced by the flow away from the center. Further out towards the coast we find the equilibrium line, where snowfall and melt are exactly balanced. Below the equilibrium line, there is more melt than snowfall and here the net mass loss is countered by the flow coming out from the center of the ice sheet. Here it is the ice sheet itself which melts.

For an ice sheet that neither grows or shrinks, there is at all points averaged over the year a balance between
  • the amount of snow that falls and is compressed to ice
  • the amount of snow and ice that melts or evaporates (sublimates) and
  • the amount of ice that flows away due to the ice motion
The two first contributions make up the surface mass balance. For the ice sheet as a whole, there is a balance between the surface mass balance and the amount of ice that calves into the ocean as icebergs. 

If climate changes, the surface mass balance may change such that it no longer matches the calving and the ice sheet can start to gain or lose mass. This is important to keep track of, since such a mass loss will lead to global sea level rise. As mentioned, satellites measuring the ice sheet mass have observed a loss of around 200 Gt/year over the last decade.

Greenland Climate Research Centre collaborates with Danish Climate Centre at DMI on research in both atmospheric impact on the Greenland Ice Sheet and the ice flow itself and its interaction with the rest of the climate system.

Three processes determine whether the ice sheet grows or diminishes. Accumulation of snow on top increases mass. In time, the snow is transformed to ice that flows down through the ice sheet and out towards the margins. Melt in the lower regions of the ice sheet and iceberg calving from glaciers reduces the mass. If mass loss exceeds mass gain the ice sheet will shrink. Graphics Diego Winterborg.

For further information please contact climate scientist Peter L. Langen, Danish Climate Centre, iskappe@dmi.dk. 

http://beta.dmi.dk/en/groenland/maalinger/greenland-ice-sheet-surface-mass-budget/
Read More
Posted in albedo, deglaciation, glacial runoff, Greenland ice melt, GrIS | No comments

Friday, July 12, 2013

Greenland surface melt area, July 10, 2013

Posted on 7:41 AM by Unknown
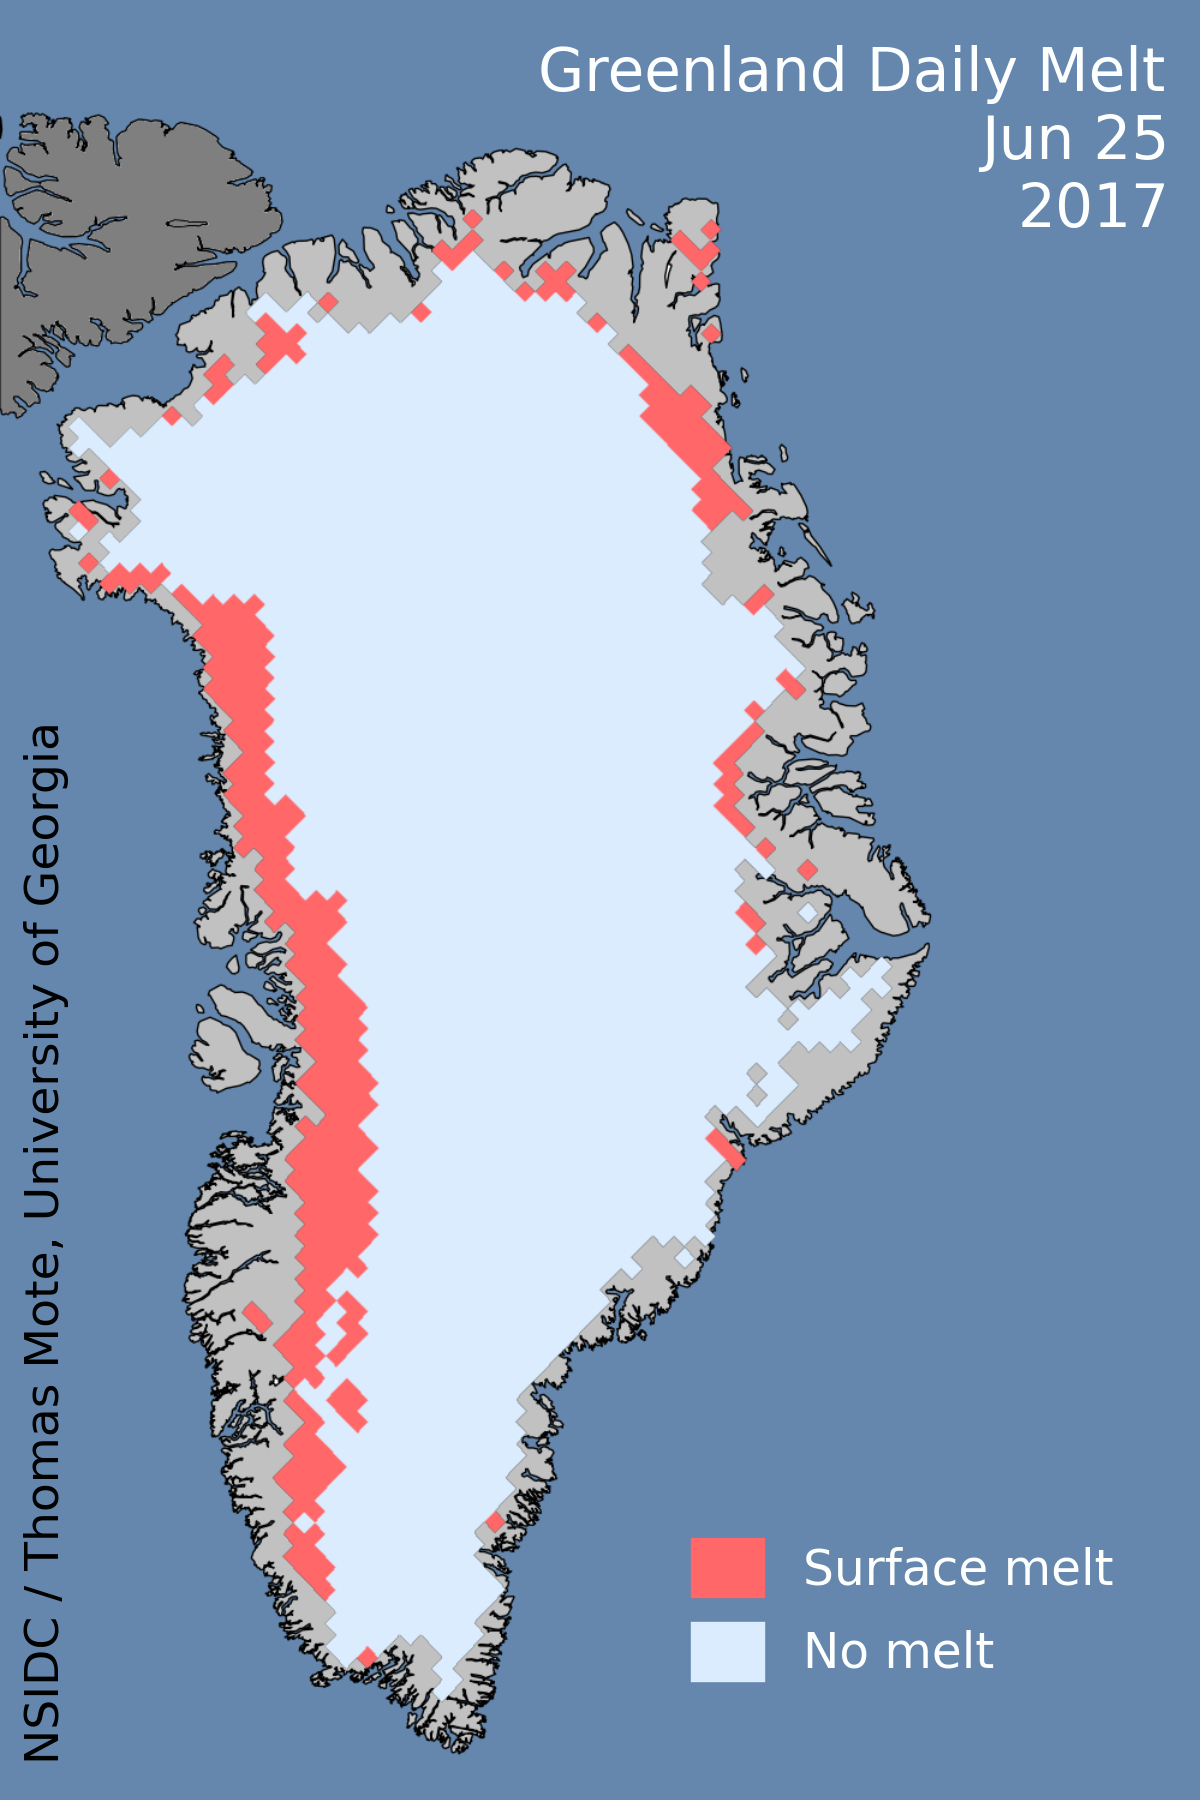
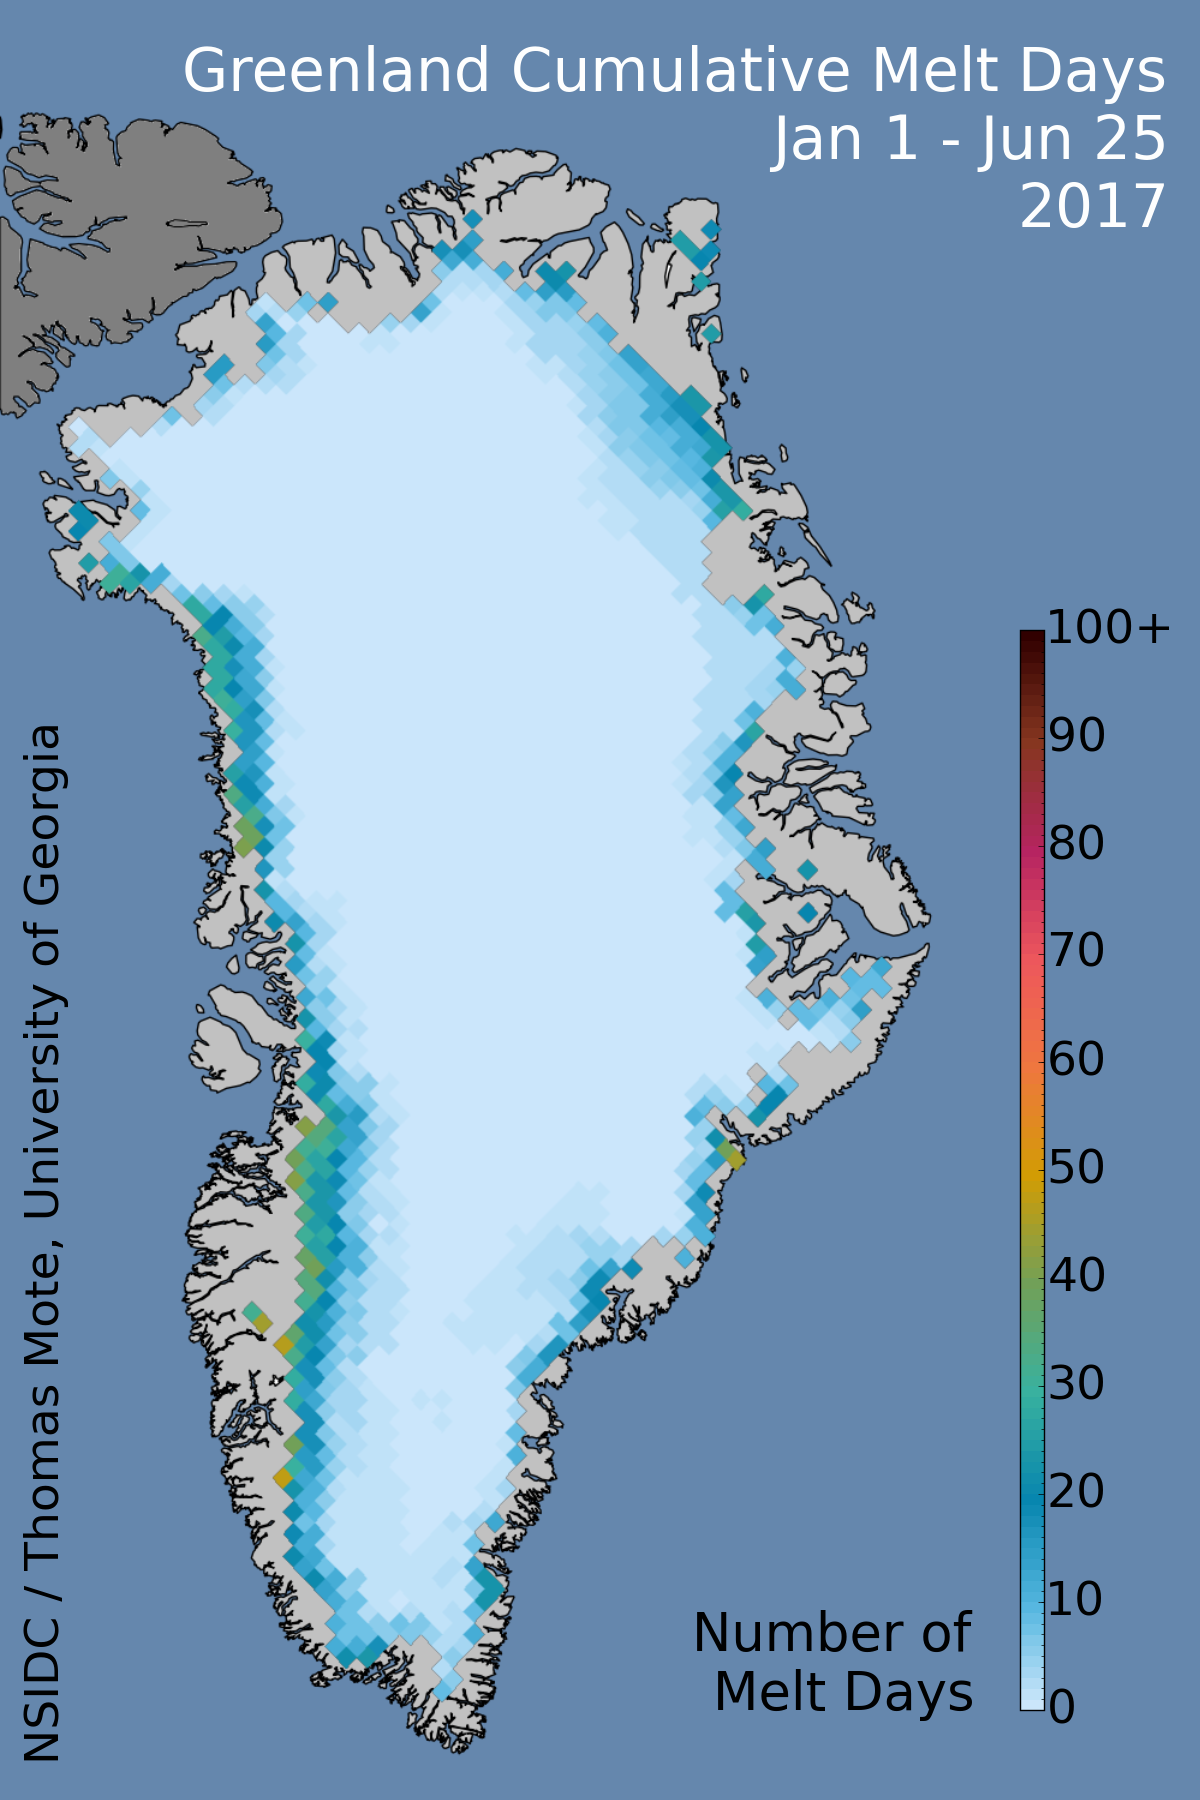
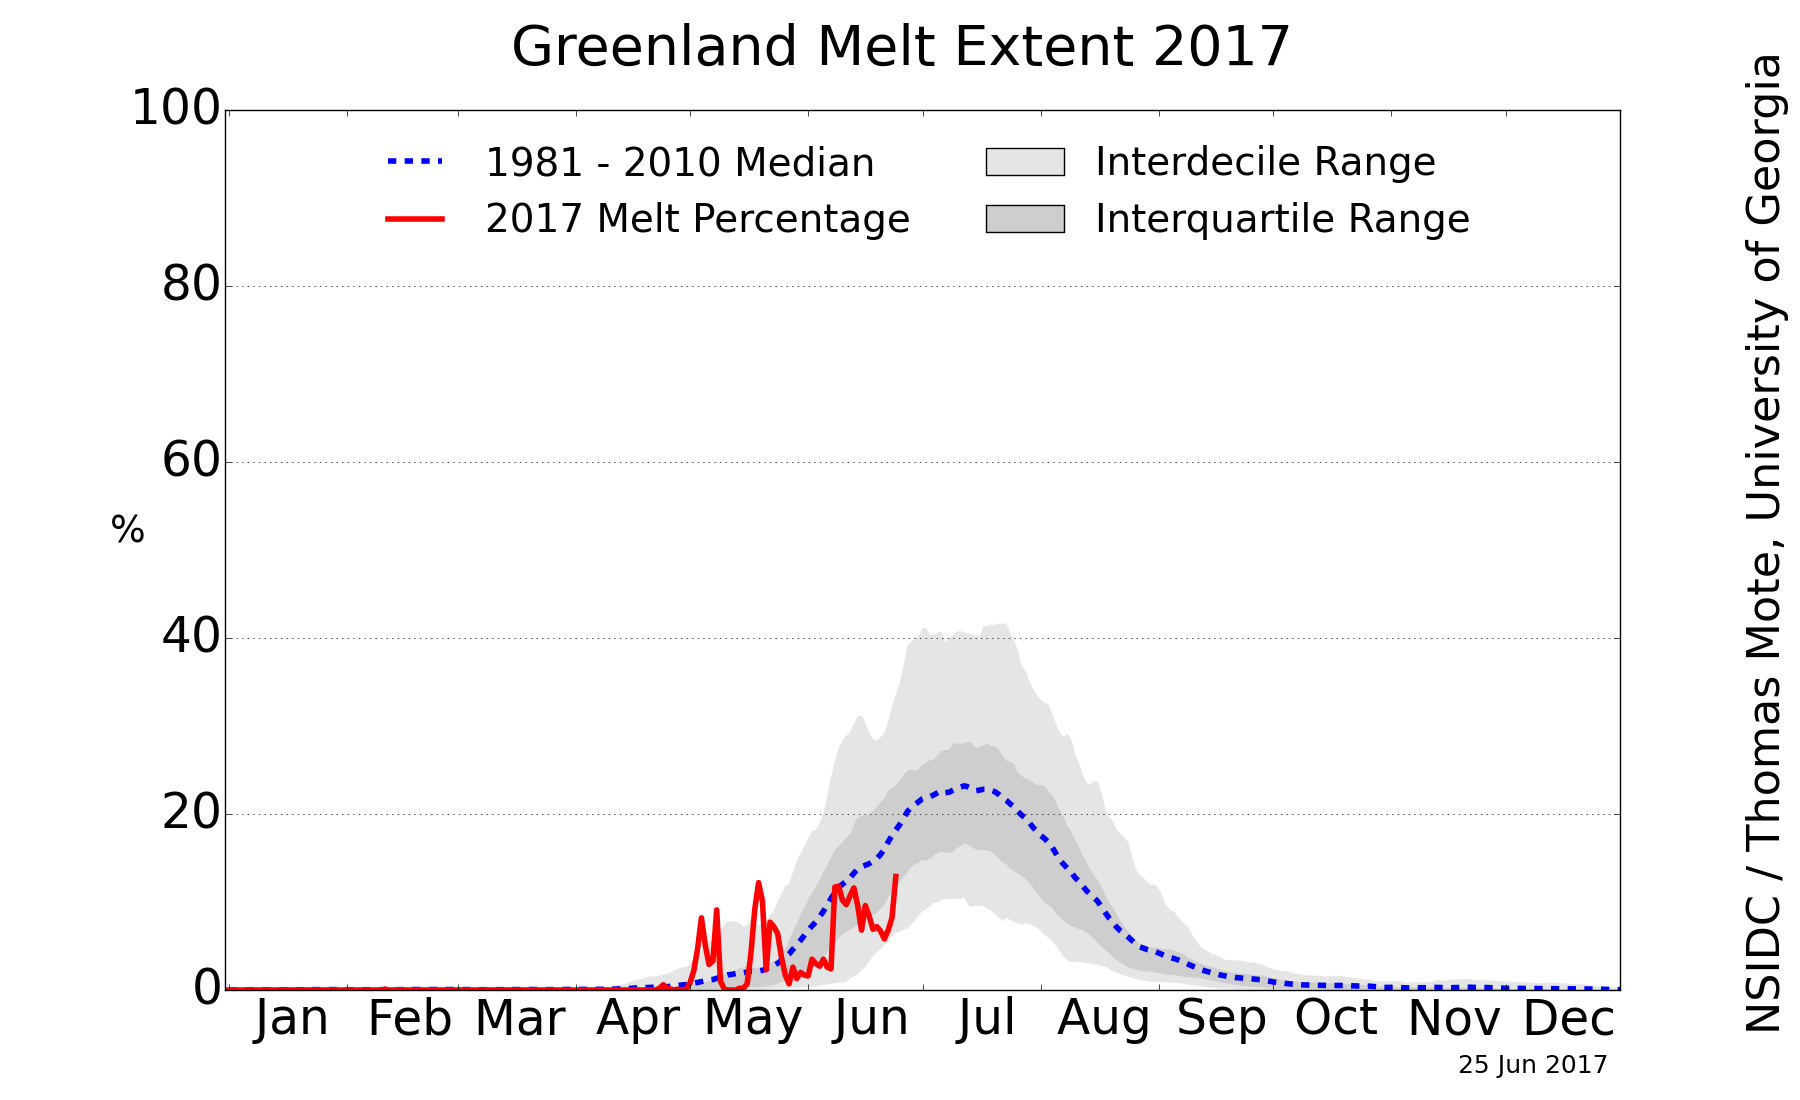
Get satellite images and information about surface melting on the Greenland ice sheet. Images are updated daily, and we post analysis periodically as conditions warrant.
Click an image for a high-resolution version.

http://nsidc.org/greenland-today/
Read More
Posted in Greenland ice melt | No comments

Wednesday, July 10, 2013

Gareth Renowden: Canadian megafires send smoke round the globe

Posted on 6:44 PM by Unknown

by gareth renowden, hot topic, july 11, 2013

Quebecfires
Massize forest fires are raging beyond control in Quebec, sending huge plumes of smoke to the east. The Eastmain fire — top left in this image from NASA’s Earth Observatory — is spreading towards the east coast of James Bay, the southernmost extension of Hudson Bay, and is currently estimated to cover an area of 656,000 hectares (1.6 million acres). Smoke from the huge fires has already caused smog problems in Montreal and Maine, and is heading round the globe. On July 8 NASA’s Terra satellite spotted a great swathe of Canadian smoke crossing Norway and Sweden, and heading across the Baltic towards Finland.
QsmokeoverNorway
The Eastmain fire is the largest wildfire in Canada since 1959, and is almost as big as all the wildfires that have burned in the US so far this year. Forecasts for the area show warm temperatures continuing for at least another 5 days, so the fire is likely to continue to spread.
Meanwhile, up on the Greenland ice sheet, Jason Box, Peter Sinclair and the Dark Snow team, who are investigating the effect of smoke particles deposited on the ice on melting, have successfully completed their first sampling mission. It’s well worth checking Sinclair’s blog for frequent updates — and lovely images — of the team’s progress.
http://hot-topic.co.nz/canadian-megafires-send-smoke-round-the-globe/
Read More
Posted in Aerosols, Canada, Forest fires, Gareth Renowden, Greenland ice melt, Jason Box, Peter Sinclair, Soot | No comments

Tuesday, June 18, 2013

Joe Romm: Exceptional 2012 Greenland Ice Melt Caused by Jet Stream Changes that May Be Driven by Global Warming

Posted on 11:40 AM by Unknown
by Joe Romm, Climate Progress, June 17, 2013

New research finds that “unusual changes in atmospheric jet stream circulation caused the exceptional surface melt of the Greenland Ice Sheet (GrIS) in summer 2012.”

Prof. Jennifer Francis tells me these changes are consistent with those caused by warming-driven “Arctic Amplification.” And that means GrIS may melt faster than climate models have projected.
Extent of surface melt over Greenland’s ice sheet on July 8, 2012 (left) and July 12, 2012. In just a few days, the melting had dramatically accelerated and an estimated 97% of the ice sheet's surface had thawed. Credit: NASA.
Back in May, a study found that by 2025, there is a “50–50 chance” of this unprecedented ice melt happening annually simply based on the continued rapid warming of GrIS.
This new study, “Atmospheric and oceanic climate forcing of the exceptional Greenland ice sheet surface melt in summer 2012,” suggests this kind of melt may become commonplace even sooner.
As the news release explains, an international team used a computer model and satellite data “to confirm a record surface melting of the GrIS for at least the last 50 years – when on 11 July 2012, more than 90% of the ice-sheet surface melted. This far exceeded the previous surface melt extent record of 52% in 2010.” Weather station data “showed that several new high Greenland temperature records were set in summer 2012.”
The research “clearly demonstrates that the record surface melting of the GrIS was mainly caused by highly unusual atmospheric circulation and jet stream changes, which were also responsible for last summer’s unusually wet weather in England.”
What were these changes? Professor Edward Hanna from the University of Sheffield’s Department of Geography explains:
“The GrIS is a highly sensitive indicator of regional and global climate change, and has been undergoing rapid warming and mass loss during the last 5–20 years. Much attention has been given to the NASA announcement of record surface melting of the GrIS in mid-July 2012. This event was unprecedented in the satellite record of observations dating back to the 1970s and probably unlikely to have occurred previously for well over a century.
“Our research found that a ‘heat dome’ of warm southerly winds over the ice sheet led to widespread surface melting. These jet stream changes over Greenland do not seem to be well captured in the latest Intergovernmental Panel on Climate Change (IPCC) computer model predictions of climate change, and this may indicate a deficiency in these models. According to our current understanding, the unusual atmospheric circulation and consequent warm conditions of summer 2012 do not appear to be climatically representative of future ‘average’ summers predicted later this century.
“Taken together, our present results strongly suggest that the main forcing of the extreme GrIS surface melt in July 2012 was atmospheric, linked with changes in the summer North Atlantic Oscillation (NAO), Greenland Blocking Index (GBI, a high pressure system centred over Greenland) and polar jet stream which favoured southerly warm air advection along the western coast.
“The next 5–10 years will reveal whether or not 2012 was a rare event resulting from the natural variability of the NAO or part of an emerging pattern of new extreme high melt years. Because such atmospheric, and resulting GrIS surface climate, changes are not well projected by the current generation of global climate models, it is currently very hard to predict future changes in Greenland climate. Yet it is crucial to understand such changes much better if we are to have any hope of reliably predicting future changes in GrIS mass balance, which is likely to be a dominant contributor to global sea-level change over the next 100–1,000 years.”
These changes in the jet stream and blocking patterns sounded quite similar to the findings of Francis, NOAA, and others. While the news release says, “The analysis shows that ocean temperatures and Arctic sea-ice cover were relatively unimportant factors in causing the extra Greenland melt,” I asked Dr. Francis if in fact these findings were consistent with her work.
She replied:
Hanna’s findings seem very consistent with the research I’ve been involved with, particularly our observations of an increasing tendency for ridging in the north Atlantic during summer. While I agree with him that sea ice loss per se may not be the primary driver of this behavior, I think it’s likely that Arctic Amplification (AA) IS playing an important role.
Sea ice loss is only one factor driving AA. In spring and summer, the AA appears to be caused mainly by 2 other factors: (1) the decline of snow cover on high-latitude land areas creates an albedo feedback similar to sea ice but is instead involves the earlier drying and heating of the soil under the snow, which promotes an earlier warm season on the continents and contributes to enhanced Arctic warming, and (2) increasing water vapor transport into the Arctic.
As you know, water vapor is a powerful greenhouse gas, it releases heat into the atmosphere when it condenses into clouds, and extra water vapor promotes additional clouds, which are also effective trappers of heat below them. The water vapor effect may be the most important for the summer ridging over Greenland, as it causes warming through a deeper layer of the atmosphere than the snow/ice effects (see Alexeev et al., Climate Dynamics, 2005; Porter et al., JGR, 2012), and thus has a more direct impact on weakening the poleward temperature gradient and consequently the jet-stream zonal winds. There was also a recent study by Von Walden and coworkers showing that cirrus clouds also caused additional surface warming over Greenland last summer, and these are just the type of clouds you’d expect to see under an upper-level ridge of high pressure.
If this ridging pattern continues to be as persistent as it has been since 2007 (see Hanna et al., 2012), then it could be that the climate models are underestimating the amount of surface melt from the Greenland ice sheet.
It would seem that warming-driven non-linear effects are starting to dominate Greenland ice melt. It may be time to redo projections of sea level rise once again.
Related Posts
  • Science Stunner: Greenland Ice Melt Up Nearly Five-Fold Since Mid-1990s
  • JPL bombshell: Polar ice sheet mass loss is speeding up, on pace for 1 foot sea level rise by 2050
  • Greenland Ice Sheet Melt Nearing Critical ‘Tipping Point’
  • Greenland Ice Sheet “Could Undergo a Self-Amplifying Cycle of Melting and Warming … Difficult to Halt,” Scientists Find
http://thinkprogress.org/climate/2013/06/17/2169321/exceptional-2012-greenland-ice-melt-caused-by-jet-stream-changes-that-may-be-driven-by-global-warming/
Read More
Posted in albedo flip, Arctic amplification, Greenland ice melt, GrIS, heat dome, Jennifer Francis, Joseph Romm, Positive feedbacks, snow cover | No comments
Older Posts Home
Subscribe to: Posts (Atom)

Popular Posts

  • James Hansen: Tar Sands and Dirty Tricks
    by James Hansen, September 13, 2013 The New Yorker just published (16 September issue) an excellent article "The President and the Pip...
  • Andrew Glikson: Another link between CO2 and mass extinctions of species
    by Andrew Glikson , The Conversation , March 22, 2013 It’s long been known that massive increases in emission of CO 2 from volcanoes, assoc...
  • Bombshell: Recent Warming Is ‘Amazing And Atypical’ And Poised To Destroy Stable Climate That Enabled Civilization
    by Joe Romm , Climate Progress , March 8, 2013 New Science Study Confirms ‘Hockey Stick’: The Rate Of Warming Since 1900 Is 50 Times Greater...
  • Real Pragmatism for Real Climate Change: Interview with Dr. John Abraham
    by John Stafford, OilPrice.com, March 26, 2013 At a time when extreme weather incidents are causing billions in damages, businesses, governm...
  • Exxon acting like national guard under martial law in Mayflower, Arkansas, Pegasus tar sands dilbit spill cleanup
    Arkansas town in lockdown after oil spill nightmare by  Suzi Parker , Grist, April 5, 2013 REUTERS / Jacob Slaton There’s one Exxon gas stat...
  • James Hansen interview (video) of why he retired from NASA to be more active in climate actions
    by Climate Science Watch, April 12, 2013 Sustainability Media Lab shot this video interview on April 10, 2013, with James Hansen on why he l...
  • Steve Horn: State Dept Keystone XL Enironmental Reviewer Claimed Delaware Tar Sands Refinery Made Air Cleaner
    by Steve Horn, DeSmogBlog, July 18, 2013 A  DeSmogBlog  investigation reveals  Environmental Resources Management, Inc. (ERM Group) , the co...
  • Steve Horn: State Department's out-sourced Keystone XL environmental impact evaluation performed without knowing pipeline's route!!!
    by Steve Horn, DeSmogBlog, July 8, 2013 The State Department's decision to hand over control to the oil industry to evaluate its own ...
  • "A Reconstruction of Regional and Global Temperature for the Past 11,300 Years," by S. A. Marcott et al., Science, 339 (2013); doi: 10.1126/science.1228026
    Science  (8 March 2013),  Vol. 339, N o. 6124,  pp. 1198-1201  DOI:  10.1126/science.1228026 REPORT A Reconstruction of Regional and Global ...
  • Steve Horn: The Flip Side of Obama’s Keystone XL Delay
    Even as President Obama cast a veneer of caution over the Keystone pipeline’s northern half, he quietly expedited dozens of similar projec...

Categories

  • 2012 temperatures (3)
  • 2013 temperatures (6)
  • acidizing (1)
  • Adam Siegel (1)
  • Adaptation (1)
  • Aerosols (7)
  • Africa (2)
  • Al Gore (1)
  • Alaska (6)
  • albedo (2)
  • albedo flip (5)
  • ALEC (8)
  • Alun Hubbard (2)
  • Amazon rainforest (1)
  • Andrew C. Revkin (2)
  • Andrew Freedman (1)
  • Andrew Glikson (1)
  • Andrew J. Weaver (1)
  • Antarctic bottom water (2)
  • Antarctic Circumpolar Winds (1)
  • Antarctic Ice Sheet -- Western (WAIS) (4)
  • Antarctic Oscillation - AAO (1)
  • Antarctic warming (1)
  • Anthony R Ingraffea (1)
  • Anthony Watts (1)
  • Arctic amplification (7)
  • Arctic melt season (1)
  • Arctic Methane Emergency Group (7)
  • Arctic Ocean (5)
  • Arctic Oscillation (5)
  • Arctic sea ice mean speed (4)
  • Arctic sea ice volume (24)
  • Argo (1)
  • Atlantic Meridional Overturning Circulation - AMOC (2)
  • Atmospheric CO2 (8)
  • Australia (6)
  • Barry Bickmore (1)
  • bees (9)
  • Benjamin Santer (4)
  • Bidder 70 (1)
  • Big Oil Big Coal (89)
  • Bill McKibben (11)
  • Black carbon (2)
  • BOEMRE (2)
  • Brad Johnson (1)
  • Brazil (2)
  • Brian Eister (2)
  • Canada (24)
  • Carbon sinks (2)
  • Catastrophic climate change (1)
  • Charles Monnett (3)
  • China (15)
  • Chris Mooney (1)
  • Civil resistance (33)
  • Climate Change Criminals (24)
  • Climate Denial Machine (47)
  • Climate modelling (5)
  • Climate Patriots (2)
  • Climate sensitivity (1)
  • CO2 draw-down (1)
  • Consequences to infrastructure (1)
  • contrails (1)
  • coral reefs (1)
  • Corexit (1)
  • corrupt officials (60)
  • Coupled ice-ocean model (3)
  • Coupled ocean–atmosphere model (2)
  • crop yields (9)
  • CRU e-mails (2)
  • CryoSat-2 (1)
  • cyclones (2)
  • Dana Nuccitelli (9)
  • Dansgaard–Oeschger event (1)
  • David Roberts (2)
  • David Spratt (2)
  • Deforestation (2)
  • deglaciation (1)
  • Denial psychology (9)
  • divestment (11)
  • Donors Trust (2)
  • Drought (9)
  • dust (1)
  • earthquakes (3)
  • East Siberian Arctic Shelf (1)
  • Eastern Siberian Arctic Shelf -- ESAS (2)
  • Eemian (3)
  • Eli Rabett (5)
  • Elizabeth Kolbert (1)
  • Ellesmere (1)
  • ENSO (11)
  • Eric Rignot (1)
  • Extreme weather events (15)
  • Ferrel cells (1)
  • First Nations (9)
  • Flooding (7)
  • floods (1)
  • Forest fires (3)
  • fracking (47)
  • Fred Singer (1)
  • freshwater lens (1)
  • fugitive emissions (2)
  • Gareth Renowden (2)
  • Gavin Schmidt (3)
  • Geoengineering (1)
  • George Monbiot (2)
  • Gerald Meehl (2)
  • glacial runoff (1)
  • Global dimming (1)
  • glyphosate (1)
  • Graham Readfearn (9)
  • Greenland ice melt (21)
  • Greenpeace (3)
  • Greg Laden (3)
  • GrIS (9)
  • Hadley cells (2)
  • Hadley circulation (2)
  • Hans Joachim Schellnhuber (1)
  • Harrison Loony Tool Schmitt (1)
  • Heartland Institute (14)
  • heat dome (3)
  • Heat waves (13)
  • hockey stick (10)
  • Holocene thermal maximum (2)
  • hurricanes (1)
  • IceSat (2)
  • Igor Semiletov (4)
  • Inhofe (2)
  • Insurers (2)
  • Intertropical Convergence Zone - ICZ (2)
  • Jakobshavn Isbræ (1)
  • James Hansen (15)
  • Jason Box (10)
  • Jeff Masters (6)
  • Jennifer Francis (7)
  • Jeremy Grantham (1)
  • Jet stream (4)
  • John Abraham (15)
  • John Christy (1)
  • John Cook (2)
  • John Kerry (2)
  • Joseph Romm (12)
  • Josh Willis (2)
  • Judith Curry (1)
  • Julie Brigham-Grette (1)
  • Justin Gillis (3)
  • Katharine Hayhoe (2)
  • Kerry Emanuel (2)
  • Kevin Grandia (1)
  • Kevin Trenberth (14)
  • Keystone Principle (14)
  • Keystone XL (57)
  • Koch Industries (13)
  • Konrad Steffen (2)
  • Lake El'gygytgyn (1)
  • Leo Hickman (2)
  • Marc Morano (3)
  • Mark Boslough (1)
  • Mark Hertsgaard (1)
  • Mark Serreze (1)
  • Mass extinctions (1)
  • Mauri Pelto (1)
  • Medieval Climate Anomaly (2)
  • Meridonal heat transport - MHT (1)
  • Methane (2)
  • Methane Gun hypothesis (9)
  • Methane hydrates (11)
  • Michael Mann (20)
  • Michael Oppenheimer (2)
  • Michael Tobis (2)
  • Milne Ice Shelf (1)
  • Mitigation (1)
  • Monckton (6)
  • Monsanto (3)
  • Myles Allen (1)
  • Naomi Klein (1)
  • Natalia Shakhova (4)
  • national security (3)
  • Neela Banerjee (1)
  • neonicotinoid pesticide (9)
  • Nitrous oxide (1)
  • North Atlantic meridional overturning circulation (1)
  • North Atlantic Oscillation (2)
  • Obama (1)
  • OccupyWallStreet (5)
  • ocean acidification (2)
  • Ocean chemistry (1)
  • ocean heat content (15)
  • Ocean salinity (2)
  • Ocean temperatures (4)
  • ozone levels (1)
  • paleo-climate (4)
  • Paleo-CO2 (2)
  • Patrick Michaels (1)
  • Paul Douglas (1)
  • PDO - Pacific Decadal Oscillation (4)
  • Peak food (10)
  • Peak oil (1)
  • Peak Water (3)
  • Permafrost (1)
  • Permafrost - subsea (2)
  • Permian mass extinction (1)
  • Peter Gleick (3)
  • Peter Sinclair (13)
  • Peter Wadhams (4)
  • Petermann Glacier (1)
  • Phil Jones (1)
  • Pinatubo rebound effect (2)
  • pine beetles (1)
  • Pine Island Glacier (1)
  • PIOMAS (3)
  • polar bears (5)
  • Polar jet stream (8)
  • Polar vortex (2)
  • Positive feedbacks (1)
  • Precipitation extremes (4)
  • radiative forcing (2)
  • Ray Weymann (1)
  • Raypierre (1)
  • resilience (1)
  • resource scarcity (3)
  • Richard Alley (3)
  • Richard Somerville (1)
  • Rick Piltz (2)
  • Robert Corell (1)
  • Roger Pielke Jr. (1)
  • Rossby waves (2)
  • Russia (1)
  • saltwater intrusion (1)
  • Scott Mandia (1)
  • Sea level rise (13)
  • sea surface temperature anomalies (1)
  • Sediment cores (2)
  • Shell Oil (4)
  • snow cover (3)
  • Snowden (1)
  • Solar activity (1)
  • solar radiation (1)
  • Soot (3)
  • Stefan Rahmstorf (5)
  • Steve Horn (13)
  • Storm intensity (1)
  • Storm tracks diverted polewards (1)
  • Stratospheric Sudden Warmings (3)
  • sulfoxaflor (1)
  • Tamino (1)
  • tar sands (57)
  • Ted Scambos (1)
  • Terracide (1)
  • These people are completely insane (7)
  • Thomas L. Friedman (2)
  • threat multiplier (1)
  • Threat to our democracy (49)
  • Tim DeChristopher (1)
  • Tipping elements (1)
  • Tom Steyer (1)
  • Tornado statistics (2)
  • TransCanada (3)
  • trees (1)
  • tropospheric water vapor (1)
  • Typhoon Yasi (1)
  • Van Jones (2)
  • volcanism (1)
  • WAIS (1)
  • Waleed Abdalati (1)
  • Walker circulation (2)
  • Walt Meier (1)
  • Water shortage (2)
  • William Krabill (1)
  • Willie Soon (1)
  • Wind pattern changes (2)
  • Wind power (2)

Blog Archive

  • ▼  2013 (500)
    • ▼  September (27)
      • James Hansen: Tar Sands and Dirty Tricks
      • Summer 2013 weather extremes tied to extraordinari...
      • Court rulings show judges accept climate science
      • DC judge denies another effort to derail Michael M...
      • Scientist Michael Mann named in top 10 influential...
      • Justin Gillis, NYT: A Climate Alarm, Too Muted for...
      • Top Obama aide Heather Zichal worked the Pavillion...
      • Call Sacramento. Vote NO on SB4
      • Graham Readfearn: The undiscerning climate bookshelf
      • Graham Readfearn: Australia's Department of Defenc...
      • Top Occupy Wall Street Cartoons
      • URGENT: phone your CA rep to prevent industry amen...
      • Tom Steyer, NexGen: Keystone XL bad economics for ...
      • Daily Mail Lies! No 60% recovery in Arctic sea ice...
      • Steve Horn: The Flip Side of Obama’s Keystone XL D...
      • Joseph E. Stiglizt, NYT: Why Janet Yellen, Not Lar...
      • "Global crop exposure to critical high temperature...
      • Naomi Klein: Green groups may be more damaging th...
      • Margaret Heffernan: Dare to Disagree
      • "Spring snow cover extent reductions in the 2008-2...
      • U.S. Becomes Largest Wood Pellet Exporter,Enviva, ...
      • Rebuttal to Michael Tobis' unsubstantiated attacks...
      • Why trust climate models? It’s a matter of simple ...
      • Steve Horn: "Frackademia" By Law: Section 999 of t...
      • MUST SEE, Peter Sinclair: No Slowdown in Global Wa...
      • Dana Nuccitelli: The Pacific Ocean fills in anothe...
      • Posts from August 2013
    • ►  August (78)
    • ►  July (74)
    • ►  June (56)
    • ►  May (62)
    • ►  April (105)
    • ►  March (98)
Powered by Blogger.

About Me

Unknown
View my complete profile