TheNextGeneration

  • Subscribe to our RSS feed.
  • Twitter
  • StumbleUpon
  • Reddit
  • Facebook
  • Digg

Thursday, April 4, 2013

GEOS-5 Analyses and Forecasts of the Major Stratospheric Sudden Warming of January 2013

Posted on 2:13 PM by Unknown
by Lawrence Coy and Steven Pawson, NASA's Global Modelling and Assimilation Office, March 2013

Stratospheric sudden warmings (SSWs) are a ubiquitous feature of the wintertime flow in the northern hemisphere. Discovered more than sixty years ago (Sherhag, 1952) when radiosonde observations began to provide routine observations at altitudes higher than 20 km above the surface of the earth, these events take their name from a rapid temperature increase of several tens of Kelvin over a few days in the high northern latitudes. Since the initial discovery of this warming, routine radiosonde observations and satellite datasets have been used to construct a fairly complete picture of the dynamical nature of these events, which are caused by the propagation and evolution of planetary scale wave motions in the troposphere and stratosphere. A major midwinter SSW event occurs when polar stratospheric temperatures increase by at least 25 K in one week, and the zonal-mean zonal wind at or near 10 hPa (at about 30 km altitude) reverses direction and becomes easterly north of 60° N. Research has led to a good documentation of the frequency and seasonality of sudden warmings: just over half of the winters since 1960 have experienced a major warming event in January or February (e.g., Charlton & Polvani, 2007). The event in early January 2013 is thus not atypical, but, like all of these events, has unique dynamical characteristics in terms of its development and interactions with the tropospheric flow.
Recent advances in the GEOS-5 analysis and forecasting system present an opportunity to examine the SSW event of January 2013 at a level of detail that was not possible only a few years ago. The configuration of the GEOS-5 atmospheric general circulation model (AGCM) used here has 72 layers that extend from the surface of the earth up to 0.01 hPa, or about 80 km in altitude, in the upper mesosphere. Radiance observations from satellites assimilated into the GEOS-5 system provide constraints on meteorological analyses up to about 50 km, near the stratopause. In addition, GEOS-5 assimilation analyses are currently performed on a horizontal grid with points every 0.25° in latitude and 0.3125° in longitude.
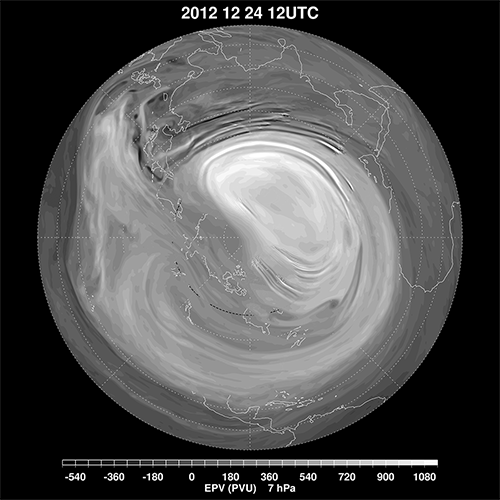
figure 1
click for larger image
Figure 1. Distribution of EPV at 7 hPa on December 24, 2013, before the SSW occurred. The EPV field is from the GEOS-5 data assimilation system, and shows EPV in potential vorticity units (PVU, 10-6K kg-1m2s-1). The shading shows regions of high EPV, typical of the polar vortex, in white, and regions of low EPV, typical of tropical air masses, in darker shades.
figure 2
click for larger image
Figure 2. As Figure 1, but for January 7, 2013, showing the breakdown of the polar vortex into three smaller vortices.
Figure 1 shows the map of Ertel's potential vorticity (EPV), a measure of the rotation of the flow that also takes the Earth's rotation and static stability into account, at 7hPa (about 35 km in altitude) on December 24, 2012. The deep-white regions represent high EPV and depict a strong, elongated polar vortex over northern Europe and Asia, with a "tail" of air advected from the main vortex, which wrapped around the northern latitudes and circumscribed the pole. Over the next few days, the GEOS-5 analyses showed the vortex distorting and breaking up, coincident with the increase in polar temperatures at 10 hPa. By January 7, 2013, the shearing of the original polar vortex by the winds led to the existence of three smaller, interconnected vortices (Figure 2), located over Canada, northern Eurasia, and northeastern Siberia. By January 14, the weakest of these vortices (over Siberia) disappeared (see Figure 3). At this time, the vortex located over Canada was the stronger of the pair, but with the low EPV values remaining over the pole, the high-latitude stratosphere was still anomalously warm. Further stretching and shearing of the vortices occurred, leading to a situation with no well-formed polar vortex for several days. By January 22, as seen in Figure 4, the flow appeared to be reorganizing, with a broad region of cyclonic circulation developing near the pole.
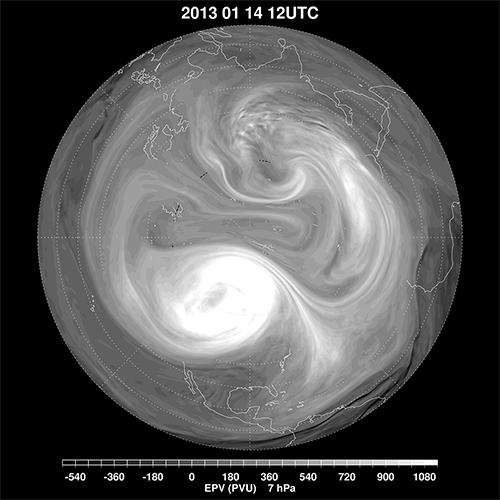
figure 3
click for larger image
Figure 3. As Figure 1, but for January 14, 2013, with a large vortex forming over Canada.
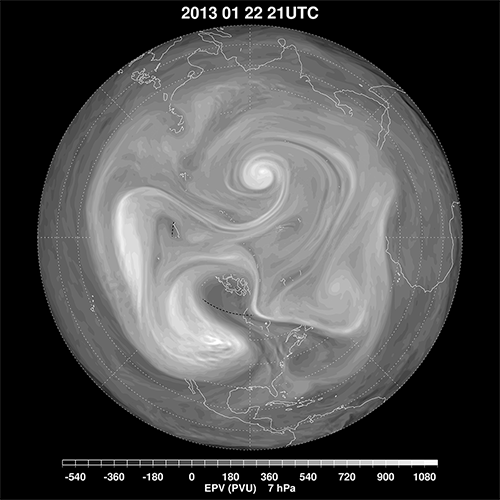
figure 4
click for larger image
Figure 4. As Figure 1, but for January 22, 2013, showing the development of a broad cyclonic flow, likely signifying the formation of a new polar vortex and the end of the SSW.
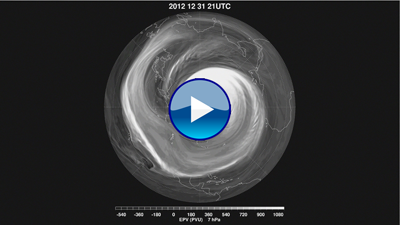
The animation of these northern hemisphere EPV fields from the GEOS-5 atmospheric analyses shows the evolution of this major SSW of January 2013. The movie starts in mid-December 2012 and continues through the various phases of the warming event, until the end of January. The animation includes one frame from every three hours of the GEOS-5 assimilation. Beginning in mid-December, low EPV air (dark in color) can be seen coming up from lower latitudes and being entrained in the polar flow, generating an anti-cyclonic circulation that disrupts the polar vortex. Evident in the animation are the vortex distortion before the warming and the breakdown associated with the shift in wind direction around January 6, when the event was officially classified as a major SSW. Also seen is the subsequent unsettled nature of the flow in the following days, which remained highly disturbed into late January.
Frame from animation
» Smaller Version (15MB MPEG4)  |  » Larger Version (44MB MOV)
Animation: GEOS-5 analyses of the distribution of EPV (in PVU) in the Northern Hemisphere hourly, from 00Z December 15, 2012 to 21Z January 28, 2013. As in the other figures of EPV presented here, lighter shades represent regions of high EPV, while darker shades represent regions of low EPV.
Along with the four daily analyses, two five-day forecasts, initialized at 00Z and 12Z, were produced using the GEOS-5 AGCM. Evaluation of these forecasts in the stratosphere revealed that GEOS-5 was able to predict the onset and evolution of the SSW event well, even capturing the distorted flow patterns with some accuracy up to four-to-five days in advance. For instance, the five-day forecast launched at 12Z on January 2, 2013, began to display the substantial change in wind and temperature in the upper stratosphere. That forecast predicted that by January 7, the temperature in the polar stratosphere at 10hPa would increase by more than 40 K, and the zonal (East-to-West) winds at high latitudes would reverse direction. As can be seen in the time series in Figure 5, this forecast was verified, and a cross section of 10 hPa temperature at polar latitudes from the GEOS-5 analyses shows that the model was able to forecast the increase in polar stratospheric temperatures very realistically. Additionally, the forecast wind profile at 60° N closely matches the analysis profile in the stratosphere, and a cross section of 10 hPa winds in the polar latitudes shows a good agreement between the forecast and the analysis at the same time (see Figure 6).
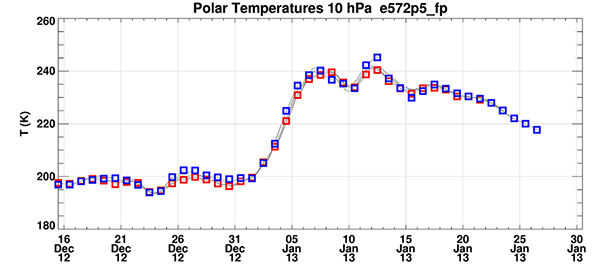
figure 5
click for larger image
Figure 5. Time series of observed (red squares) and five-day forecast (blue squares) temperature, in Kelvin, at 10 hPa in the polar latitudes. Each plotted grey line connects an analysis (red square) to the forecast (blue square) it initialized five days earlier.
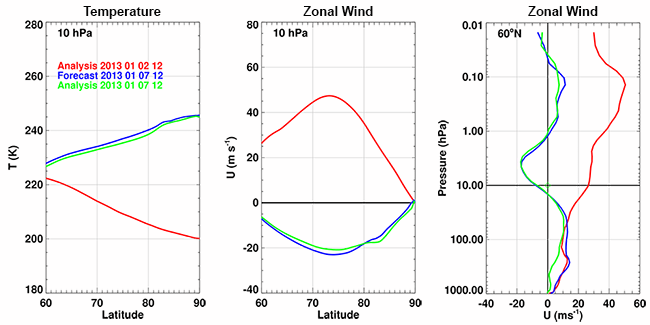
figure 6
click for larger image
Figure 6. Cross section of forecast (blue) and observational analyses (red and green) of stratospheric temperatures (K, left) and zonal winds (m/s, middle), and profile of zonal winds (m/s, right): Winds and temperatures at 12Z on January 2, 2013 show conditions pre-warming, and the winds and temperatures at 12Z on January 7, 2013 show that the January 2 12Z five-day forecast predicted the event very well. Note the log scale on the rightmost wind plot.
Consistent with SSWs, GEOS-5 also forecast that the polar vortex would break apart, and the five-day forecast valid at 12Z on January 7 predicted that the three smaller vortices seen in the analyses at that time would form. The forecast vortices formed close to where they appeared in the analyses, and were largely similar in shape to those observed. The exception is the Eurasian vortex, which, as seen in Figure 7, was more elongated in reality than it was in the five-day forecast. In Figure 8, the five-day forecast of EPV valid at 12Z on January 14 depicts two vortices, the largest and strongest of which is over Canada. This forecast is also very similar to the analysis from the same time, though the smaller vortex is weaker in the analysis, and slightly west of its forecast position. The five-day forecast valid at 12Z on January 17 (see Figure 9) shows that GEOS-5 was able to predict that the stratospheric flow in the poles was still in flux, as lower EPV air can be seen entering the flow and disturbing the large vortex that had formed over Canada.
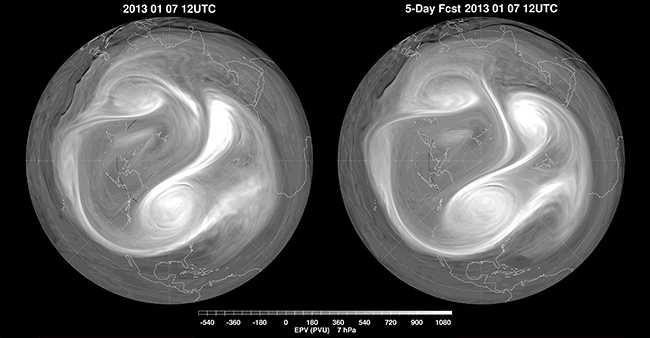
figure 7
click for larger image
Figure 7. As in Figure 1, for January 7, 2013. GEOS-5 analysis at left, and five-day forecast at right.
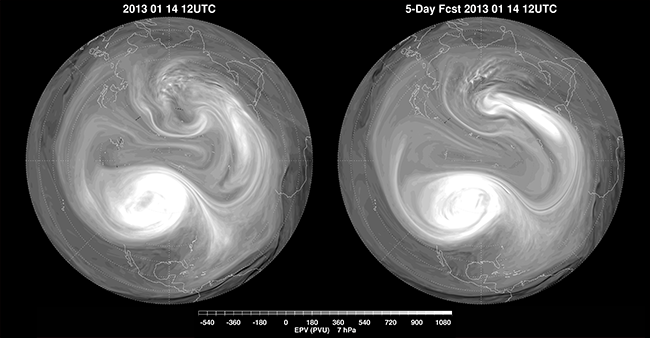
figure 8
click for larger image
Figure 8. As in Figure 1, for January 14, 2013. GEOS-5 analysis at left, and five-day forecast at right.
Because of the timing of this major warming event in early January 2013, there is ample time for a polar vortex to re-establish in the polar region, with a return to low temperatures near the pole. Though the GEOS-5 five-day forecasts, as of January 25 2013, still predict a disturbed flow pattern at high latitudes in the stratosphere, they are beginning to show the reformation of a polar vortex at higher altitudes. A slow cooling along with the establishment of a new polar vortex are typical features of mid-winter SSWs.
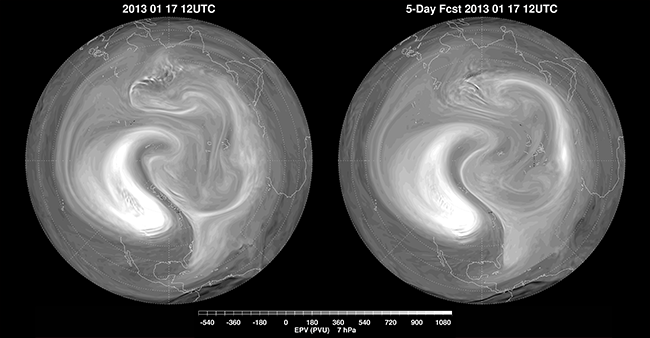
figure 9
click for larger image
Figure 9. As in Figure 1, for January 17, 2013. GEOS-5 analysis at left, and five-day forecast at right.
In summary, the quarter-degree resolution GEOS-5 analyses depict the distortion and breakdown of the stratospheric polar vortex in January of 2013 with a degree of detail that was unprecedented just a few years ago. The accuracy of the analyses and the integrity of the underlying GEOS-5 model lead to a successful prediction of this SSW event up to five days in advance, with the initial displacement of the vortex followed by its dynamical breakdown into three smaller vortices. Routine GEOS-5 forecasts currently end at five days, so this work suggests that extensions out to 10 days would offer value for future studies of the stratosphere.
http://gmao.gsfc.nasa.gov/researchhighlights/SSW/
Email ThisBlogThis!Share to XShare to FacebookShare to Pinterest
Posted in Polar vortex, Stratospheric Sudden Warmings | No comments
Newer Post Older Post Home

0 comments:

Post a Comment

Subscribe to: Post Comments (Atom)

Popular Posts

  • Time for serious discussion about climate disruption, mitigation and preparedness
    Please see video at link http://www.climatesciencewatch.org/2013/07/19/wild-weather/
  • James Hansen: Tar Sands and Dirty Tricks
    by James Hansen, September 13, 2013 The New Yorker just published (16 September issue) an excellent article "The President and the Pip...
  • 77 ALEC Bills Advance Big Oil, Big Ag Agenda in 2013
    by Brendan Fischer, EcoWatch, August 2, 2013 Crude oil and greed fuel much of the ALEC agenda. At least 77 bills to oppose renewable energy ...
  • Living Laboratory for Coping with Drought in Brazil
    by   Mario Osava , Inter Press Service, July 4, 2013 Abel Manto with a rainwater tank and the beans he is growing despite two years of conti...
  • Alun Hubbard and Jason Box: Greenland ice sheet research -- expedition aboard sailing vessel Gambo
    This is a great video from 2009, still completely relevant: http://vimeo.com/22626746
  • Snowden NSA scandal: UK grabs David Miranda, partner of Glenn Greenwald, and detains him for 7 hours at Heathrow
    David Miranda: 'They said I would be put in jail if I didn't co-operate' Partner of Guardian journalist Glenn Greenwald gives hi...
  • Neela Banerjee: Climate change may bring drought to temperate areas, study says
    Climate change may bring drought to temperate areas, study says 'Wet areas will get wetter and dry areas will get drier,' says a sci...
  • Our international police state: Britain Detains the Partner of a Reporter Tied to Leaks
    by Charlie Savage and Michael Schwirtz, The New York Times , August 18, 2013 WASHINGTON — The partner of Glenn Greenwald, the journalist for...
  • IMPORTANT READ: SkyTruth, the environment and the satellite revolution
    by Neely Tucker, The Washington Post Magazine , July 31, 2013 Go to link to see remarkable video, I can't get the code to stay fixed: ht...
  • Between 6 and 12% of the Uinta Basin’s natural gas production escaping into the atmosphere
    (Trent Nelson | Tribune file photo) Equipment in the oil fields of the Uinta Basin shown in 2012. A new report says much more methane...

Categories

  • 2012 temperatures (3)
  • 2013 temperatures (6)
  • acidizing (1)
  • Adam Siegel (1)
  • Adaptation (1)
  • Aerosols (7)
  • Africa (2)
  • Al Gore (1)
  • Alaska (6)
  • albedo (2)
  • albedo flip (5)
  • ALEC (8)
  • Alun Hubbard (2)
  • Amazon rainforest (1)
  • Andrew C. Revkin (2)
  • Andrew Freedman (1)
  • Andrew Glikson (1)
  • Andrew J. Weaver (1)
  • Antarctic bottom water (2)
  • Antarctic Circumpolar Winds (1)
  • Antarctic Ice Sheet -- Western (WAIS) (4)
  • Antarctic Oscillation - AAO (1)
  • Antarctic warming (1)
  • Anthony R Ingraffea (1)
  • Anthony Watts (1)
  • Arctic amplification (7)
  • Arctic melt season (1)
  • Arctic Methane Emergency Group (7)
  • Arctic Ocean (5)
  • Arctic Oscillation (5)
  • Arctic sea ice mean speed (4)
  • Arctic sea ice volume (24)
  • Argo (1)
  • Atlantic Meridional Overturning Circulation - AMOC (2)
  • Atmospheric CO2 (8)
  • Australia (6)
  • Barry Bickmore (1)
  • bees (9)
  • Benjamin Santer (4)
  • Bidder 70 (1)
  • Big Oil Big Coal (89)
  • Bill McKibben (11)
  • Black carbon (2)
  • BOEMRE (2)
  • Brad Johnson (1)
  • Brazil (2)
  • Brian Eister (2)
  • Canada (24)
  • Carbon sinks (2)
  • Catastrophic climate change (1)
  • Charles Monnett (3)
  • China (15)
  • Chris Mooney (1)
  • Civil resistance (33)
  • Climate Change Criminals (24)
  • Climate Denial Machine (47)
  • Climate modelling (5)
  • Climate Patriots (2)
  • Climate sensitivity (1)
  • CO2 draw-down (1)
  • Consequences to infrastructure (1)
  • contrails (1)
  • coral reefs (1)
  • Corexit (1)
  • corrupt officials (60)
  • Coupled ice-ocean model (3)
  • Coupled ocean–atmosphere model (2)
  • crop yields (9)
  • CRU e-mails (2)
  • CryoSat-2 (1)
  • cyclones (2)
  • Dana Nuccitelli (9)
  • Dansgaard–Oeschger event (1)
  • David Roberts (2)
  • David Spratt (2)
  • Deforestation (2)
  • deglaciation (1)
  • Denial psychology (9)
  • divestment (11)
  • Donors Trust (2)
  • Drought (9)
  • dust (1)
  • earthquakes (3)
  • East Siberian Arctic Shelf (1)
  • Eastern Siberian Arctic Shelf -- ESAS (2)
  • Eemian (3)
  • Eli Rabett (5)
  • Elizabeth Kolbert (1)
  • Ellesmere (1)
  • ENSO (11)
  • Eric Rignot (1)
  • Extreme weather events (15)
  • Ferrel cells (1)
  • First Nations (9)
  • Flooding (7)
  • floods (1)
  • Forest fires (3)
  • fracking (47)
  • Fred Singer (1)
  • freshwater lens (1)
  • fugitive emissions (2)
  • Gareth Renowden (2)
  • Gavin Schmidt (3)
  • Geoengineering (1)
  • George Monbiot (2)
  • Gerald Meehl (2)
  • glacial runoff (1)
  • Global dimming (1)
  • glyphosate (1)
  • Graham Readfearn (9)
  • Greenland ice melt (21)
  • Greenpeace (3)
  • Greg Laden (3)
  • GrIS (9)
  • Hadley cells (2)
  • Hadley circulation (2)
  • Hans Joachim Schellnhuber (1)
  • Harrison Loony Tool Schmitt (1)
  • Heartland Institute (14)
  • heat dome (3)
  • Heat waves (13)
  • hockey stick (10)
  • Holocene thermal maximum (2)
  • hurricanes (1)
  • IceSat (2)
  • Igor Semiletov (4)
  • Inhofe (2)
  • Insurers (2)
  • Intertropical Convergence Zone - ICZ (2)
  • Jakobshavn Isbræ (1)
  • James Hansen (15)
  • Jason Box (10)
  • Jeff Masters (6)
  • Jennifer Francis (7)
  • Jeremy Grantham (1)
  • Jet stream (4)
  • John Abraham (15)
  • John Christy (1)
  • John Cook (2)
  • John Kerry (2)
  • Joseph Romm (12)
  • Josh Willis (2)
  • Judith Curry (1)
  • Julie Brigham-Grette (1)
  • Justin Gillis (3)
  • Katharine Hayhoe (2)
  • Kerry Emanuel (2)
  • Kevin Grandia (1)
  • Kevin Trenberth (14)
  • Keystone Principle (14)
  • Keystone XL (57)
  • Koch Industries (13)
  • Konrad Steffen (2)
  • Lake El'gygytgyn (1)
  • Leo Hickman (2)
  • Marc Morano (3)
  • Mark Boslough (1)
  • Mark Hertsgaard (1)
  • Mark Serreze (1)
  • Mass extinctions (1)
  • Mauri Pelto (1)
  • Medieval Climate Anomaly (2)
  • Meridonal heat transport - MHT (1)
  • Methane (2)
  • Methane Gun hypothesis (9)
  • Methane hydrates (11)
  • Michael Mann (20)
  • Michael Oppenheimer (2)
  • Michael Tobis (2)
  • Milne Ice Shelf (1)
  • Mitigation (1)
  • Monckton (6)
  • Monsanto (3)
  • Myles Allen (1)
  • Naomi Klein (1)
  • Natalia Shakhova (4)
  • national security (3)
  • Neela Banerjee (1)
  • neonicotinoid pesticide (9)
  • Nitrous oxide (1)
  • North Atlantic meridional overturning circulation (1)
  • North Atlantic Oscillation (2)
  • Obama (1)
  • OccupyWallStreet (5)
  • ocean acidification (2)
  • Ocean chemistry (1)
  • ocean heat content (15)
  • Ocean salinity (2)
  • Ocean temperatures (4)
  • ozone levels (1)
  • paleo-climate (4)
  • Paleo-CO2 (2)
  • Patrick Michaels (1)
  • Paul Douglas (1)
  • PDO - Pacific Decadal Oscillation (4)
  • Peak food (10)
  • Peak oil (1)
  • Peak Water (3)
  • Permafrost (1)
  • Permafrost - subsea (2)
  • Permian mass extinction (1)
  • Peter Gleick (3)
  • Peter Sinclair (13)
  • Peter Wadhams (4)
  • Petermann Glacier (1)
  • Phil Jones (1)
  • Pinatubo rebound effect (2)
  • pine beetles (1)
  • Pine Island Glacier (1)
  • PIOMAS (3)
  • polar bears (5)
  • Polar jet stream (8)
  • Polar vortex (2)
  • Positive feedbacks (1)
  • Precipitation extremes (4)
  • radiative forcing (2)
  • Ray Weymann (1)
  • Raypierre (1)
  • resilience (1)
  • resource scarcity (3)
  • Richard Alley (3)
  • Richard Somerville (1)
  • Rick Piltz (2)
  • Robert Corell (1)
  • Roger Pielke Jr. (1)
  • Rossby waves (2)
  • Russia (1)
  • saltwater intrusion (1)
  • Scott Mandia (1)
  • Sea level rise (13)
  • sea surface temperature anomalies (1)
  • Sediment cores (2)
  • Shell Oil (4)
  • snow cover (3)
  • Snowden (1)
  • Solar activity (1)
  • solar radiation (1)
  • Soot (3)
  • Stefan Rahmstorf (5)
  • Steve Horn (13)
  • Storm intensity (1)
  • Storm tracks diverted polewards (1)
  • Stratospheric Sudden Warmings (3)
  • sulfoxaflor (1)
  • Tamino (1)
  • tar sands (57)
  • Ted Scambos (1)
  • Terracide (1)
  • These people are completely insane (7)
  • Thomas L. Friedman (2)
  • threat multiplier (1)
  • Threat to our democracy (49)
  • Tim DeChristopher (1)
  • Tipping elements (1)
  • Tom Steyer (1)
  • Tornado statistics (2)
  • TransCanada (3)
  • trees (1)
  • tropospheric water vapor (1)
  • Typhoon Yasi (1)
  • Van Jones (2)
  • volcanism (1)
  • WAIS (1)
  • Waleed Abdalati (1)
  • Walker circulation (2)
  • Walt Meier (1)
  • Water shortage (2)
  • William Krabill (1)
  • Willie Soon (1)
  • Wind pattern changes (2)
  • Wind power (2)

Blog Archive

  • ▼  2013 (500)
    • ►  September (27)
    • ►  August (78)
    • ►  July (74)
    • ►  June (56)
    • ►  May (62)
    • ▼  April (105)
      • EU restricts neonicotinoid pesticide use to help s...
      • R L Miller, DailyKos: Brian Schweitzer: bold progr...
      • Ted Glick, GRIST: Brian Eister's 27th day on hunge...
      • Climate hero Brian Eister on day 26 of hunger stri...
      • A Man For All Seasons: James Hansen Wins The Riden...
      • RealClimate: The answer is blowing in the wind: Th...
      • Richie Havens: Freedom [at Woodstock, 1969]
      • Arctic Sea Ice Loss Visualized In Animated 3-D Cha...
      • San Francisco Board of Supervisors Unanimously Pas...
      • Wisconsin GOP illegally deletes files related to r...
      • Syngenta Pesticides Kill Bees [neonicotinoid pesti...
      • Andrew Glikson: Another link between CO2 and mass ...
      • Peter Sinclair: Pesky Reality Intrudes in Deniervi...
      • Ground-level ozone confuses plants' mutualistic in...
      • Willie Soon, Koch & Exxon-funded scientist, challe...
      • Peter Sinclair: Bill McKibben to join Dark Snow p...
      • Peter Sinclair: Jet Stream Blows Winds of Change
      • Misleading GAO Report on Wind Energy Policies: GAO...
      • Dr. Charles Monnett sues U.S. Department of the In...
      • More loony tunes from Potty Peer Viscount Monckton...
      • Anti-fracking hero Sandra Steingraber sentenced to...
      • Hansen's New Climate Dice - Hot, Loaded, and Misun...
      • Peter Sinclair, Yale Forum: Greenland Ice Sheet Melt
      • Summer Ice Melt Increases Ten-fold on Antarctic Pe...
      • Advanced Energy Economy send letter to House Ways ...
      • US, China vow to boost climate efforts amid ‘incre...
      • Catholic Online: Global warming most definitely n...
      • Pulitzer Prize to Lisa Song, Elizabeth McGowan and...
      • New Interior Secretary Sally Jewell called out by ...
      • Keystone XL: Friends of the Earth files for releas...
      • Graham Readfearn: The Slippery Slope to Slime -- A...
      • Joe Romm: Silver Linings Playbook: Exxon Says Wild...
      • Global Contraction of Antarctic Bottom Water betwe...
      • Readers, a must-read: The Antarctic Half of the Gl...
      • New undemocratic rules create barrier to public pa...
      • Canadian democracy biting the dust as Harper govt....
      • Millions face starvation as world warms, say scien...
      • Arctic Circle assembly to address needs of changin...
      • David Suzuki: The Pine Beetles Are Coming
      • U.S., China joint statement calls for ‘forceful’ c...
      • Puer Loony Viscount Monckton ridiculed in New Zeal...
      • Arkansas AG McDaniel hires notorious private contr...
      • "Unsustainable fuelwood extraction from South Afri...
      • Hoerling Howler -- uses model with no skill, publi...
      • Gilbert Compo and coauthors confirm warming: 20th ...
      • Jeremy Grantham, environmental philanthropist: 'We...
      • New Study Shows Once Again How "Climategate" Email...
      • Another Hoerling Howler: NOAA study of 2012 drough...
      • James Hansen interview (video) of why he retired f...
      • Martin Luther King and the call to direct action o...
      • Exxon's Pegasus pipeline's 22-foot rupture in Mayf...
      • Neven: PIOMAS April 2013 - extra update
      • Bill McKibben: The Fossil Fuel Resistance. As the ...
      • Exxon Didn't Know Its Pipeline Ruptured Until Call...
      • Exxon threatens Little Rock TV station, causing th...
      • ALEC fascism at work in Indiana - bill would make ...
      • ExxonMobil Arkansas Tar Sands Pipeline Gash 22 Fee...
      • Arkansas AG Dustin McDaniel says Exxon's Pegasus o...
      • Breaking News: Oklahoma Grandmother Locks Herself ...
      • Giant pockmarks on the ocean floor off New Zealand...
      • Ties That Bind: Ernest Moniz, Keystone XL Contract...
      • Exxon's lying liars [Ken Cohen] and the lying lies...
      • "July 2012 Greenland melt extent enhanced by low-l...
      • NSIDC: for Arctic sea ice extent watchers: an int...
      • Our Home. She's alive. Beautiful. Finite. Hurting.
      • Of course conservatives care about the air, water ...
      • Bill McKibben: Is the Keystone XL the Stonewall o...
      • Monckton's nightmare week in New Zealand
      • Climate Hawks Go on Offense Against Skeptics in th...
      • Calamity for Our Most Beneficent Insect [bees: due...
      • David Spratt, Climate Code Red: “Critical decade” ...
      • Exxon acting like national guard under martial law...
      • Youth Explorers Embark to North Pole to Bury Time ...
      • Harvard Students Vote for Endowment Divestment fro...
      • Linking clean energy sources solves blackout conun...
      • Heavy rains due to intensify and increase dramatic...
      • Exxon Oil Spill in Mayflower, Arkansas, Photos Cou...
      • Deep oceans absorbing heat imbalance at an increas...
      • Rick Piltz: Keystone XL pipeline is why we need w...
      • Will John Kerry leave his reputation behind him bl...
      • Remarkable video and narration by scientist Ken Du...
      • President Obama, be sure to tell Malia and Sasha t...
      • Neela Banerjee: Michael Mann, the most hated clima...
      • NPR Gives Wind Power Hypochondriacs A Platform
      • Exxon threatens journalist with arrest at "command...
      • Groups Ask State Dept for 120-Day Comment Period o...
      • Tar Sands Protestors Chain Themselves To Canadian ...
      • GEOS-5 Analyses and Forecasts of the Major Stratos...
      • Arctic Sea Ice Mean Speed ready for Daytona
      • Exxon's Arkansas Tar Sands Spill: The Tar Sands Na...
      • > 1,000 Californians protest the "no jobs" Keyston...
      • Newspaper rag, The Australian, provides space for ...
      • Australian scientists say Australia's climate has ...
      • NSIDC Arctic Sea Ice Report of April 2, 2013: Sing...
      • "Independent confirmation of global land warming w...
      • NASA: Warm Arctic, Chilly Mid-Latitudes -- Arctic ...
      • ExxonMobil usurps EPA oversight of dilbit tar sand...
      • Republicans believe climate change is a problem an...
      • The Economist on climate science: Exploring uncert...
      • Winthrop Roosevelt on the Oil [Fracking] Boom that...
    • ►  March (98)
Powered by Blogger.

About Me

Unknown
View my complete profile